
CERF Blog
The latest Ventura County GDP data was released Wednesday morning by the U.S. Bureau of Economic Analysis. This release consists of GDP data for every county and metropolitan area in the U.S. It includes revisions to previously released estimates from 2001 to 2018, and it provides the BEA’s preliminary estimates of 2019 county GDP.
Revised 2001 to 2018 GDP Estimates
The revisions to Ventura County’s historical GDP data are substantial. Economic growth since 2007 is much slower than previously understood, and the size of the County’s economy in recent years is much smaller than previously measured.
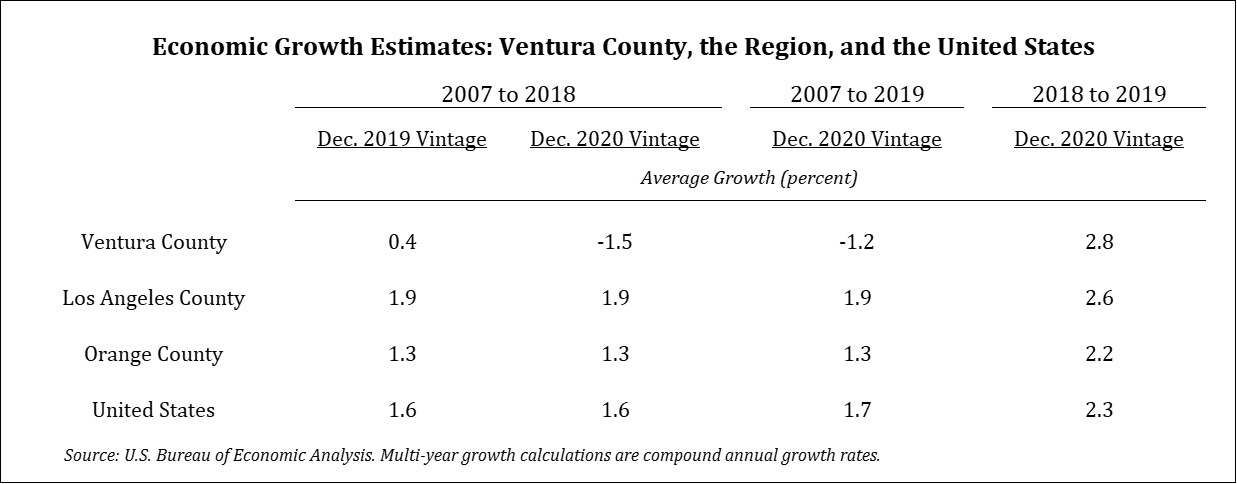
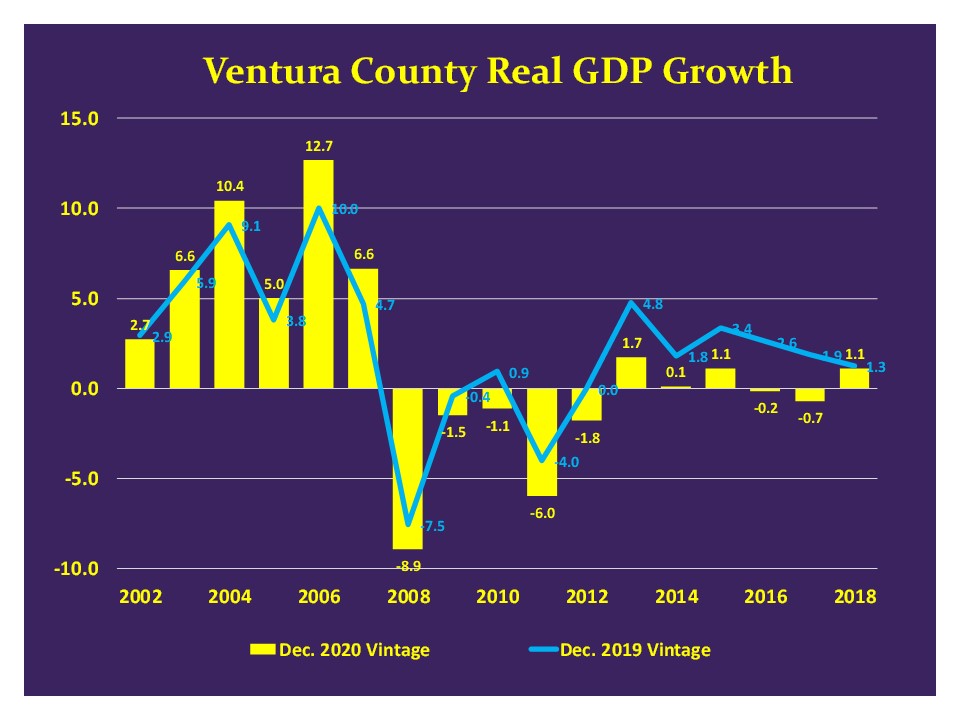
Whereas previous estimates indicated that the county’s economy grew by $2.1 billion from 2007 to 2018, the revised estimates indicate the county’s economy shrank by $8.6 billion during that time. This is a 15.4 percent decline in total economic activity. The drop represents an astonishing $26 thousand dollars per worker or $10 thousand dollars per person. The previous estimates indicated that Ventura County’s 2007 to 2018 compound annual growth rate (CAGR) was 0.4 percent, a period of sustained but anemic growth. The new data indicate that it was not a period of growth, but instead, a contractionary period. The County’s economy contracting by an annual average rate of 1.5 percent per year. While the U.S. economy expanded in every year from 2010 to 2019, Ventura County’s economy contracted during five out of those ten years.
The BEA’s revised GDP data corroborate other key measures of the County’s poor economic health that CERF has documented for the past three years. Three very important measures are population growth, domestic migration, and civilian labor force growth. Each of these measures has indicated a sustained period of economic weakness, going back to at least 2013. Ventura County population growth was negative in three out of the last four years. Net domestic migration has been negative for nine consecutive years. Civilian labor force growth has been negative for seven years. See our recently released Ventura County Economic Forecast essay for detailed analysis along with graphical and tabular presentations of data. The story detailed in that publication is fundamentally unchanged by the BEA revisions, although the period of sustained economic weakness documented in that publication now appears longer and more severe.
The following table provides the comparisons, where the most recent comparison year is 2018.
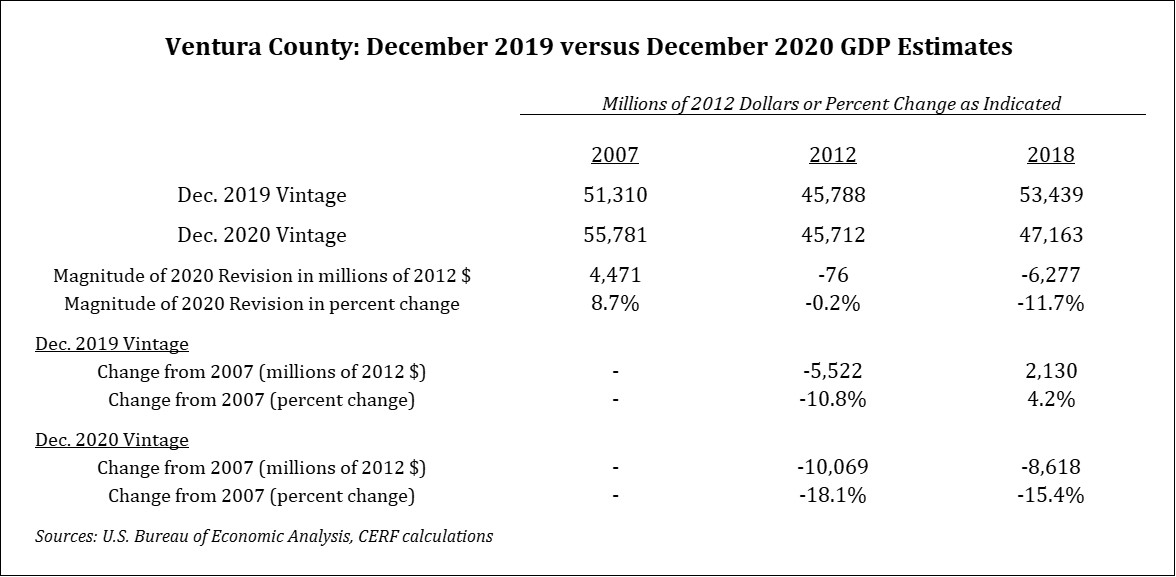
These estimates also provide us with a new understanding of the current size of the County’s economy. Perhaps the most important takeaway is that the BEA’s revised estimate of the size of the County’s 2018 economy is nearly 12 percent smaller than the estimate released last year. This is a $6.3 billion dollar reduction in size as a result of the revision.
According to revised data, while the U.S. economy expanded continuously from July 2009 until February 2020, Ventura County’s economy contracted continuously from 2007 to 2012, and contracted again from 2015 to 2017. The magnitude of the economic decline from 2007 to 2012 was relatively large at $10 billion dollars or 18 percent, while the magnitude of the 2015 to 2017 contraction was small, at $0.4 billion dollars. I also note that the revised data indicate that the County’s 2001 to 2007 compound annual growth rate was higher than previously estimated, at 7.3 percent compared to the old estimate of 6.1 percent.
Stepping back from the details of the new estimates, the data revisions that have impacted Ventura County GDP in the past two years are large, and as such it is natural to feel betrayed by earlier estimates. One way to deal with this is to also review other measures of economic vitality as done in the comments above. Another is to realize that focusing on the growth rate for just one year, or another, might not be helpful. Instead, we can look at what the data is saying over larger spans of time, such as three, five, or even ten years. This is what we have done in the analysis and tabular presentations in this article. Finally, we should be clear-eyed that new revisions will impact this data yet again a year from now.
Previously Unavailable 2019 GDP Estimates
The previously unavailable estimates of 2019 Ventura County GDP indicate that the County’s economy grew 2.8 percent from 2018 to 2019. This is the strongest estimated growth since 2007, when the County expanded by 6.6 percent. The relatively rapid 2019 growth rate raises the County’s 2007-to-2019 compound annual growth rate from -1.5 to -1.2 percent. The recent boost in growth is welcome, especially if it is not revised away in December 2021, when the BEA re-estimates County GDP. To be honest, we are worried this is exactly what will happen. We note that the average revision of growth since 2007 from the 2018 to the 2019 vintage was negative 0.5 percent. This year’s average revision (from the 2019 to 2020 vintage) was a whopping negative 1.9 percent. Also, we note that the all-industries job growth rate fell from 1.3 percent in 2018 to 0.9 percent in 2019, underscoring a diminishing economic outlook. And, as mentioned above, many other key Ventura County measures are indicating sustained or deepening economic weakness.
The estimates of Ventura County’s 2020 GDP, scheduled for release in December of 2021, will indicate an structural break due to the pandemic. Looking forward to 2021 and beyond, we hope that County policy makers can take advantage of what might be a rare and golden opportunity. There is evidence of urban flight emanating from the Los Angeles metropolitan area that is currently benefiting Ventura County. We see this in housing markets data, which is described in detail in the 2020 Ventura County Real Estate essay. If the county can attract households and businesses who desire to leave urban areas as a result of the pandemic, then Ventura County’s ongoing stagnant economic conditions could be slowed or reversed.
