
CERF Blog
Recent Retail Sales data, October and November, have been relatively strong for an economy that is barely recovering from the Great Recession. Recent personal consumption expenditures, the national account data that is much broader than Retail Sales, surprised me with a strong growth rate of 2.8 percent per annum during quarter 3.
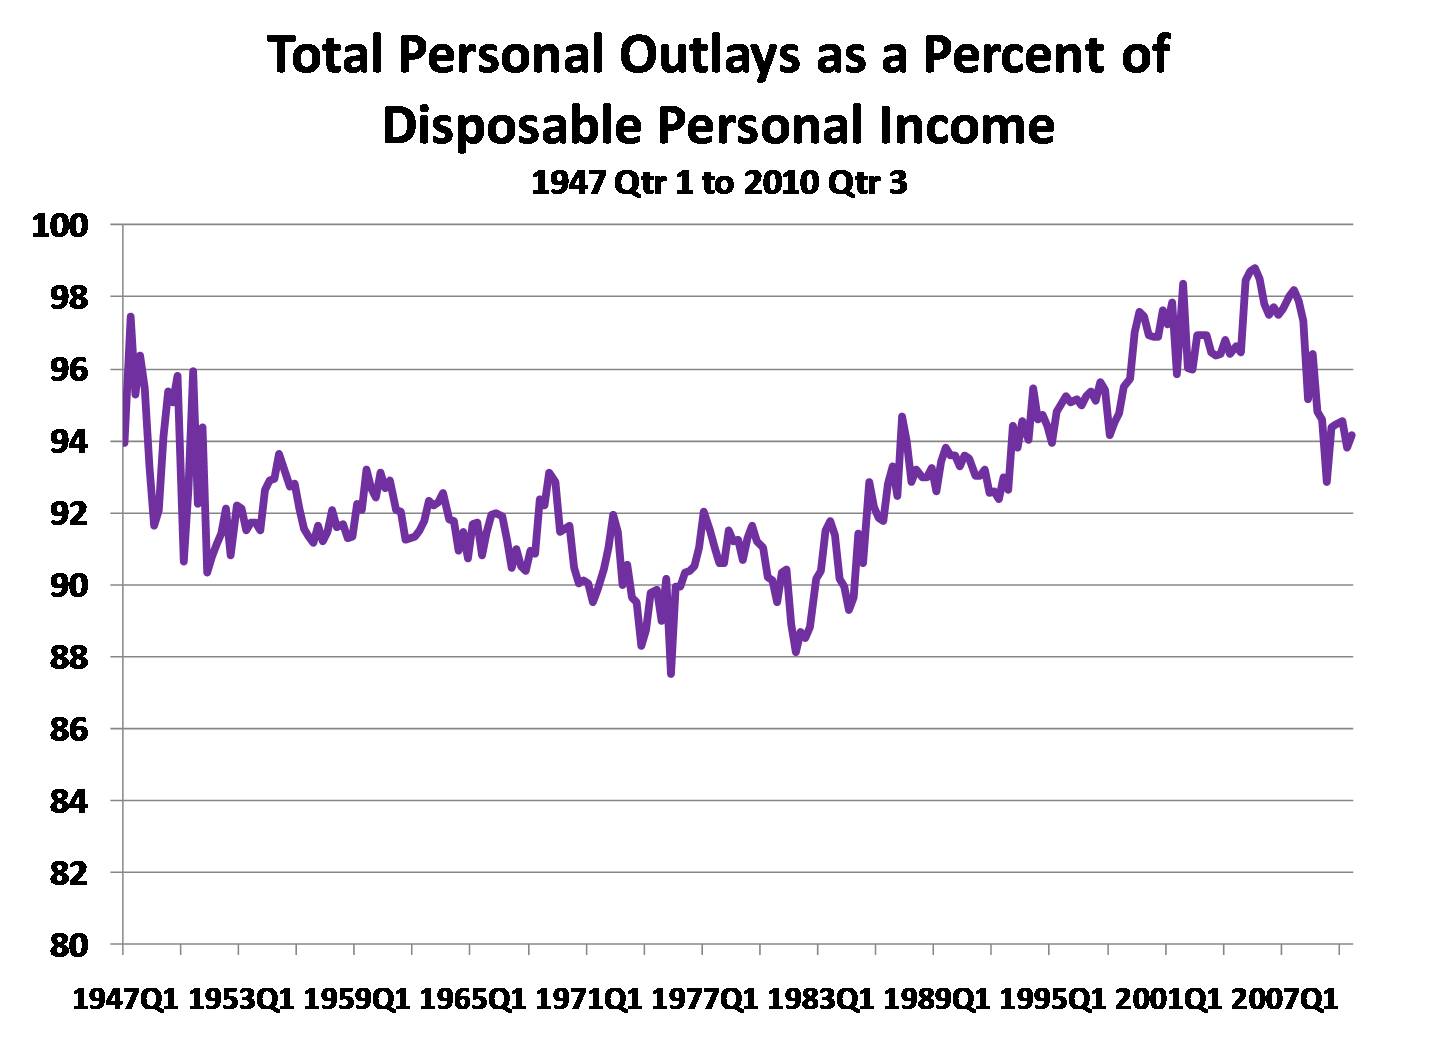
I have blogged many times that the household sector needs to rebuild their balance sheets. That implies a slower current consumption growth rate in the near term than otherwise. A natural question is: is spending back to a level that is sustainable? I use national accounts data to create a chart below that is total personal outlays by the household sector (BEA table 2.1) divided into total personal disposable income.
As to be expected, we can see that the spending share of income rose to a historically high level of 99 percent during the 2005 to 2007 housing bubble. And, as one would expect, it has been falling recently, the most recent quarter 3 value is 94.2 percent. The long-term average of this measure is 92.9 percent but this includes the bubble and also periods of high outlays in the late 1940s that appear out of character compared with all of the 1950s, 1960s, and 1970s. The average over the period from 1948 through 1999 is 92 percent.
From a standpoint of re-establishing a structure of spending and income that are at healthy levels for long-term economic health I would argue that 92 percent is better than 94 percent. Spending is still too high.

