
CERF Blog
Matthew Fienup & Dan Hamilton (Original post 12/13/19, edits 12/15/19)
The U.S. Bureau of Economic Analysis (BEA) released its annual Metro GDP dataset yesterday which provides economic growth figures for our regional economy. The release includes a new Ventura County GDP growth estimate for 2018 as well as significant, and truly surprising, revisions to the economic history of Ventura County going back to 2002.
Plainly, this revision to the County’s economic history paints a different picture than the one that we described in our Annual Ventura County Economic Forecast publication. Importantly, there have been significant upward revisions to the county’s economic performance over the past five years. These are accompanied by significant downward revisions to the county’s performance during and following the Great Recession.
Below, the chart on the left shows the Sept. 2018 vintage estimates of Ventura County GDP growth and the current release, Dec. 2019. The bar chart on the right shows the “gap” between the two vintages of estimates, calculated by subtracting the Sept. 2018 estimates from the data in the new release.
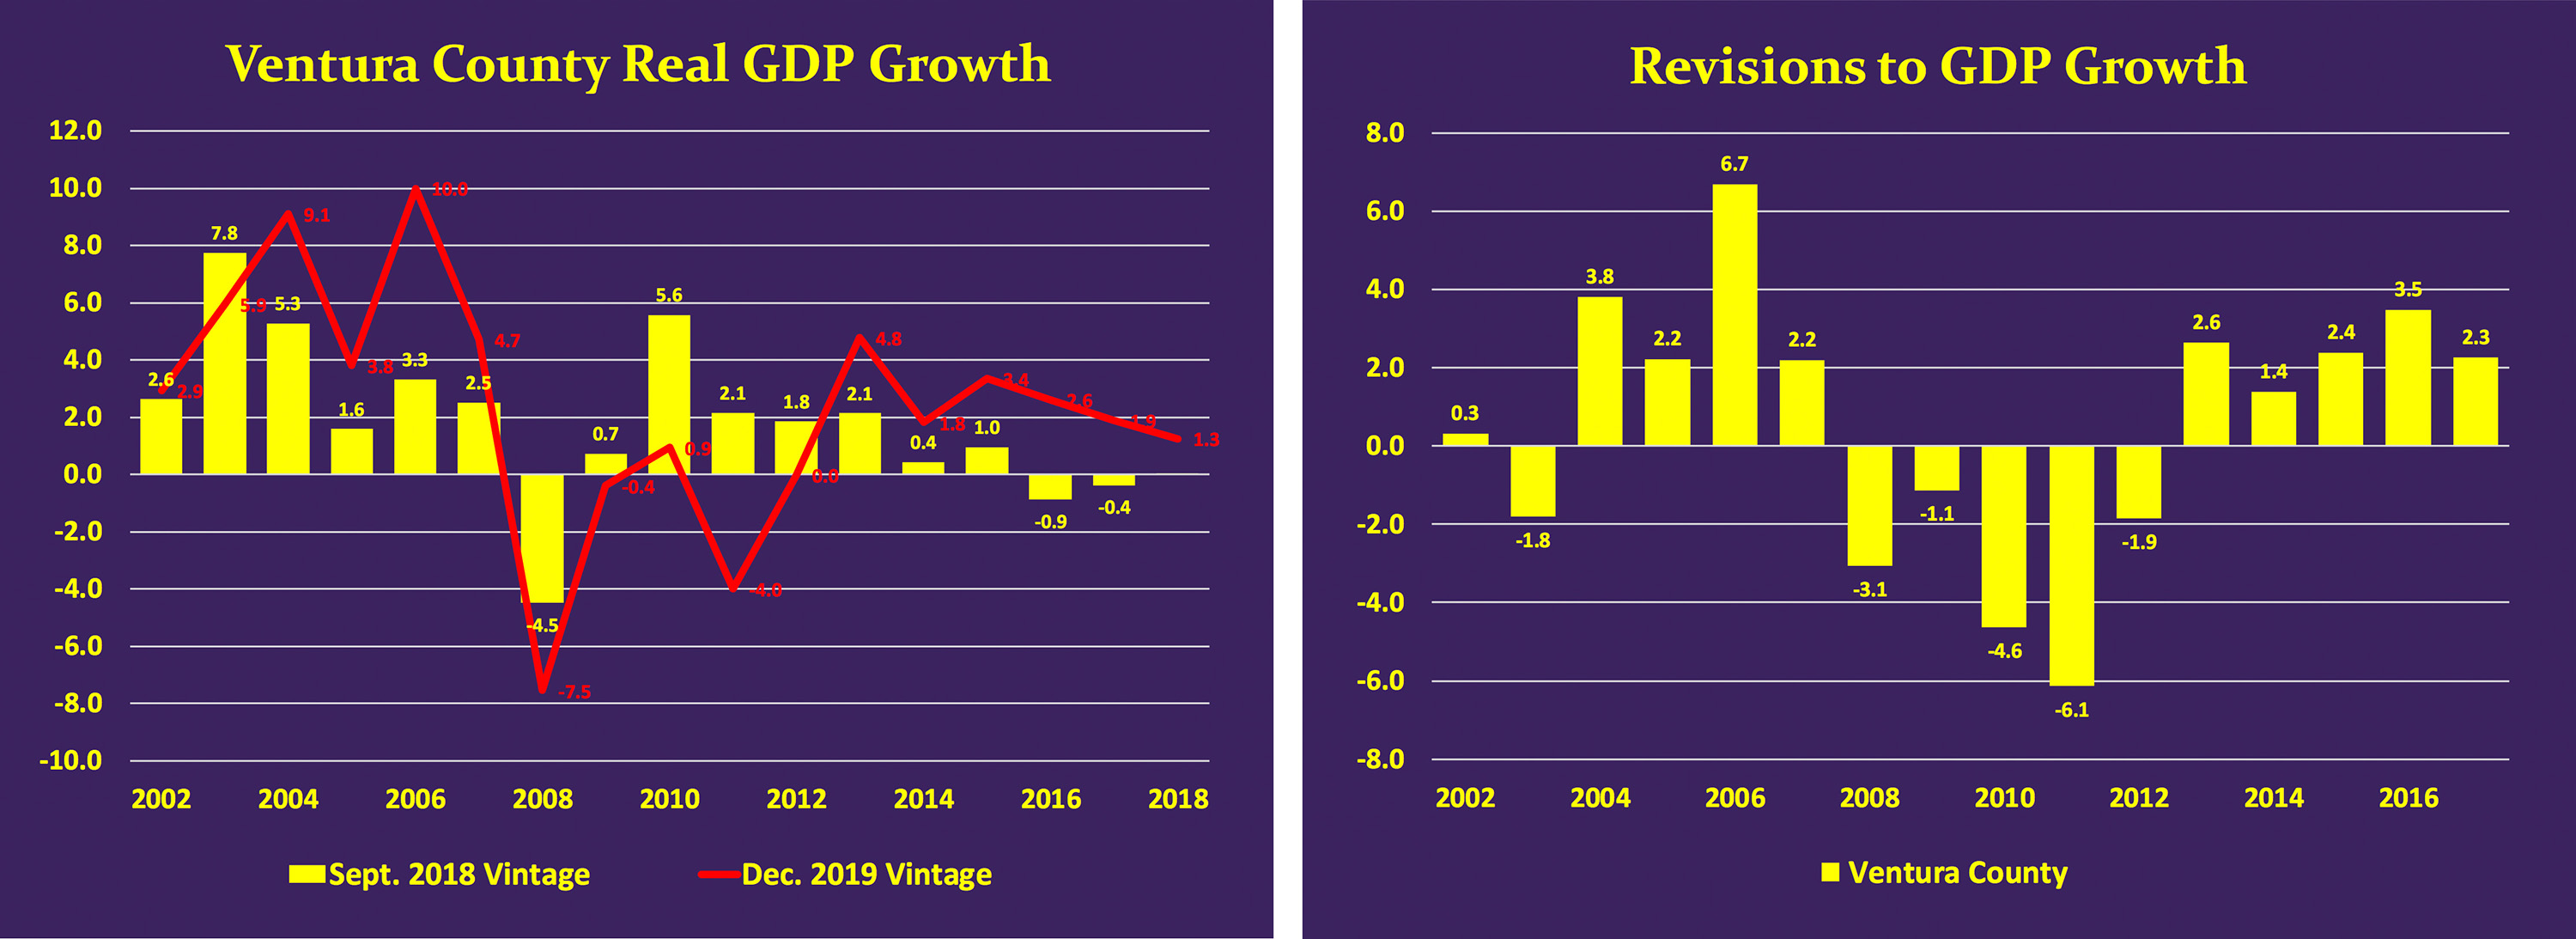
Key takeaways from the revised economic data for Ventura County are these:
Average economic growth since the Financial Crisis is somewhat weaker than previously estimated. Average growth from 2008 to 2017 was previously estimated to be 0.8 percent. With the latest revisions, average growth during this period is now estimated to be 0.3 percent.
The Financial Crisis and the Great Recession hit Ventura County much harder than previously thought. Previous vintages of the County’s economic data indicated that the County experienced a single year of negative economic growth during the Great Recession. Revised data indicate that the County experienced five years of economic hardship beginning with the Great Recession. Average growth from 2008 to 2012, which was previously estimated to be 1.2 percent, has been revised down to -2.2 percent. Ventura County experienced five years of economic contraction. This is consistent with jobs data that we have been tracking since 2008. Ventura County was the last county in Southern California to recover the pre-recession number of jobs. It was not until 2018 that this happened, an arresting figure.
The past five years no longer appear to be the weakest on record in Ventura County. By comparison, the five years beginning with the financial crisis now appear significantly weaker.
The recession was deeper but the recovery, which began in 2011 and peaked in 2013, was far stronger and more rapid than previously understood.
The sustained decline in economic growth which Ventura County is currently enduring began later than previously thought, but the decline is more rapid than previously thought. In the previous vintage of data, the post-Recession peak of economic growth was estimated to be in 2010. It now appears that peak growth was reached in 2013. The decline in economic growth since 2013, which was previously estimated to be 250 basis points, is now estimated to be 290 basis points. Because the economy was starting its slowdown from a higher growth rate, economic growth remains positive despite the more rapid slowdown.
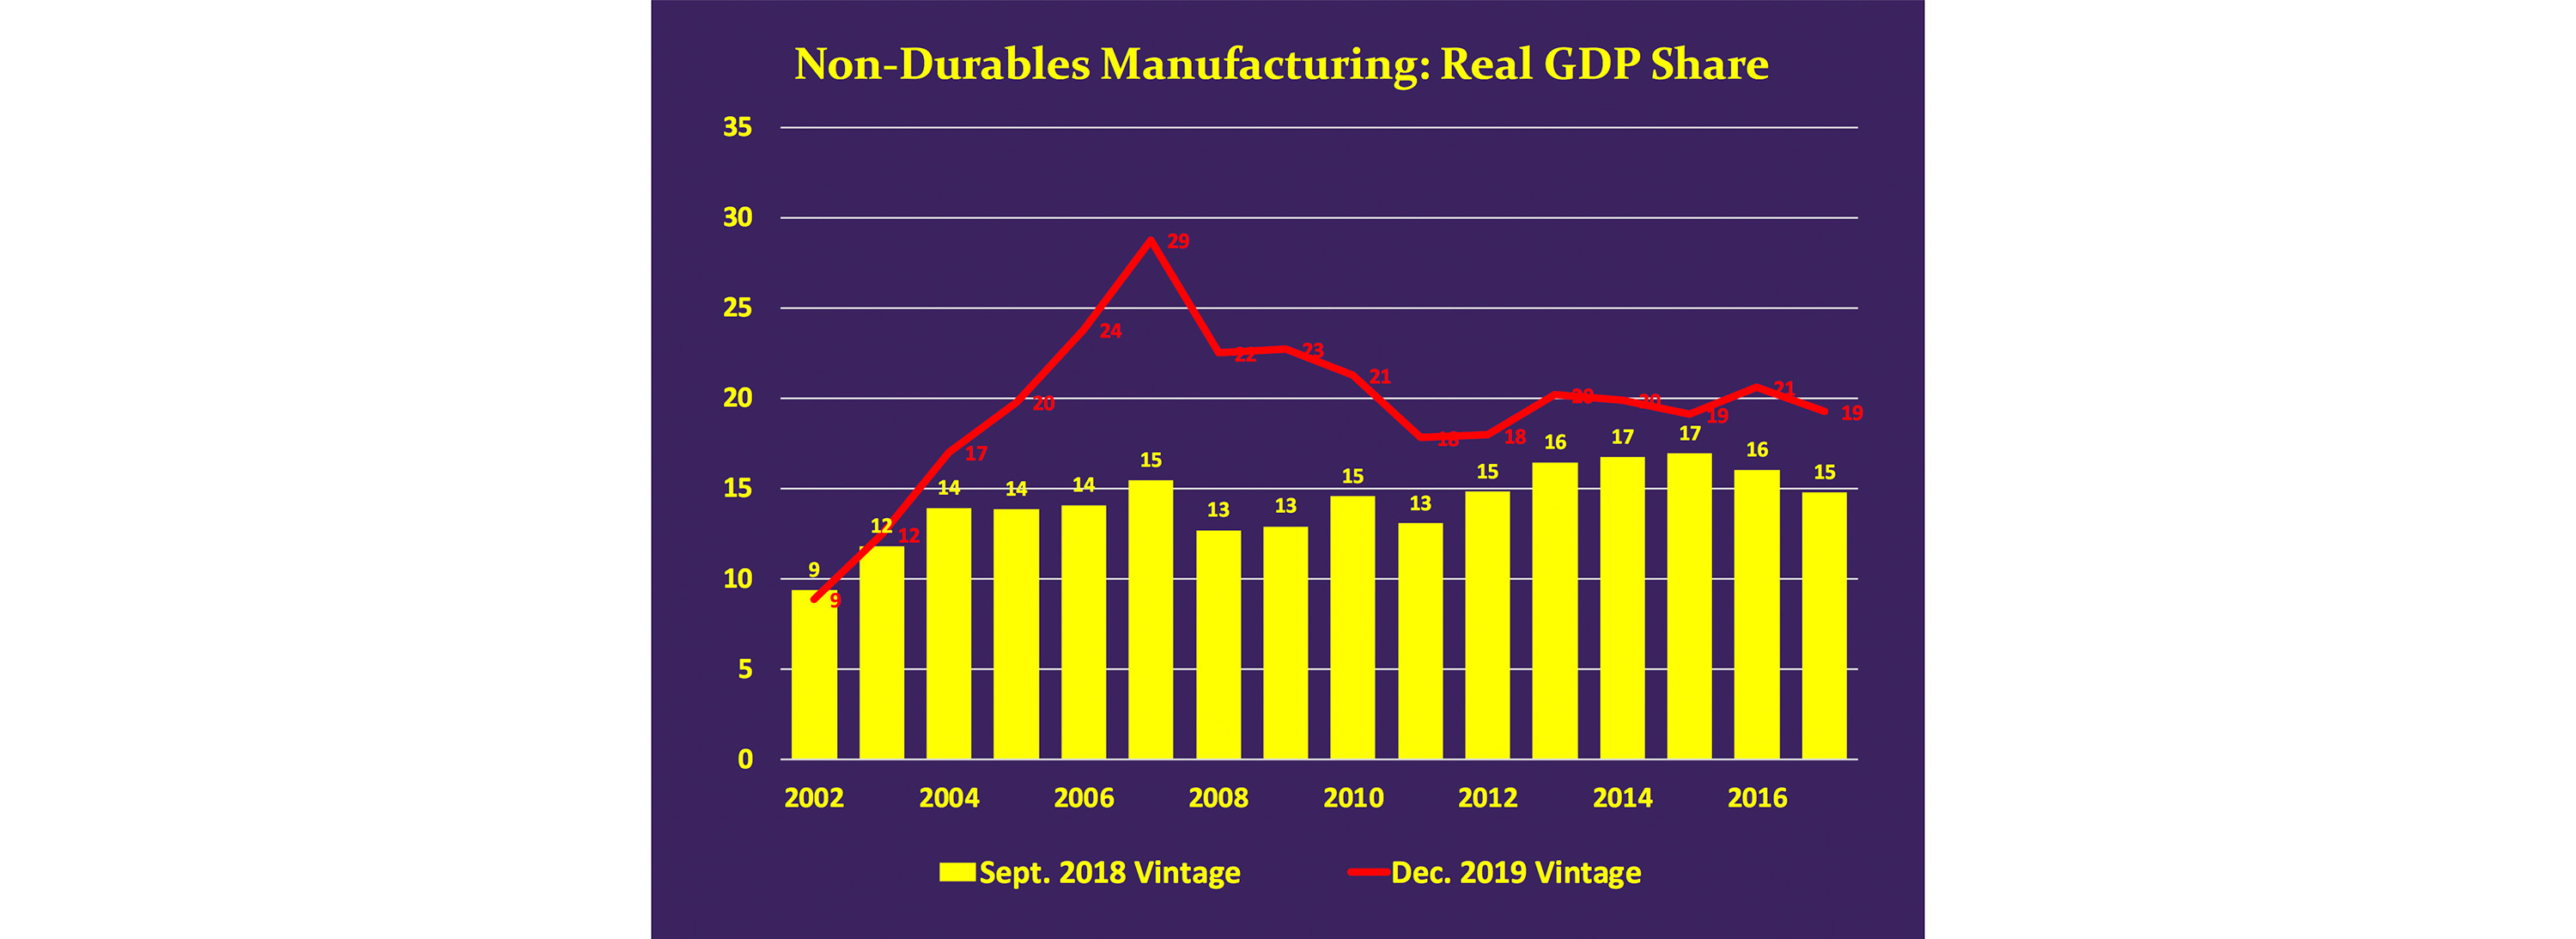
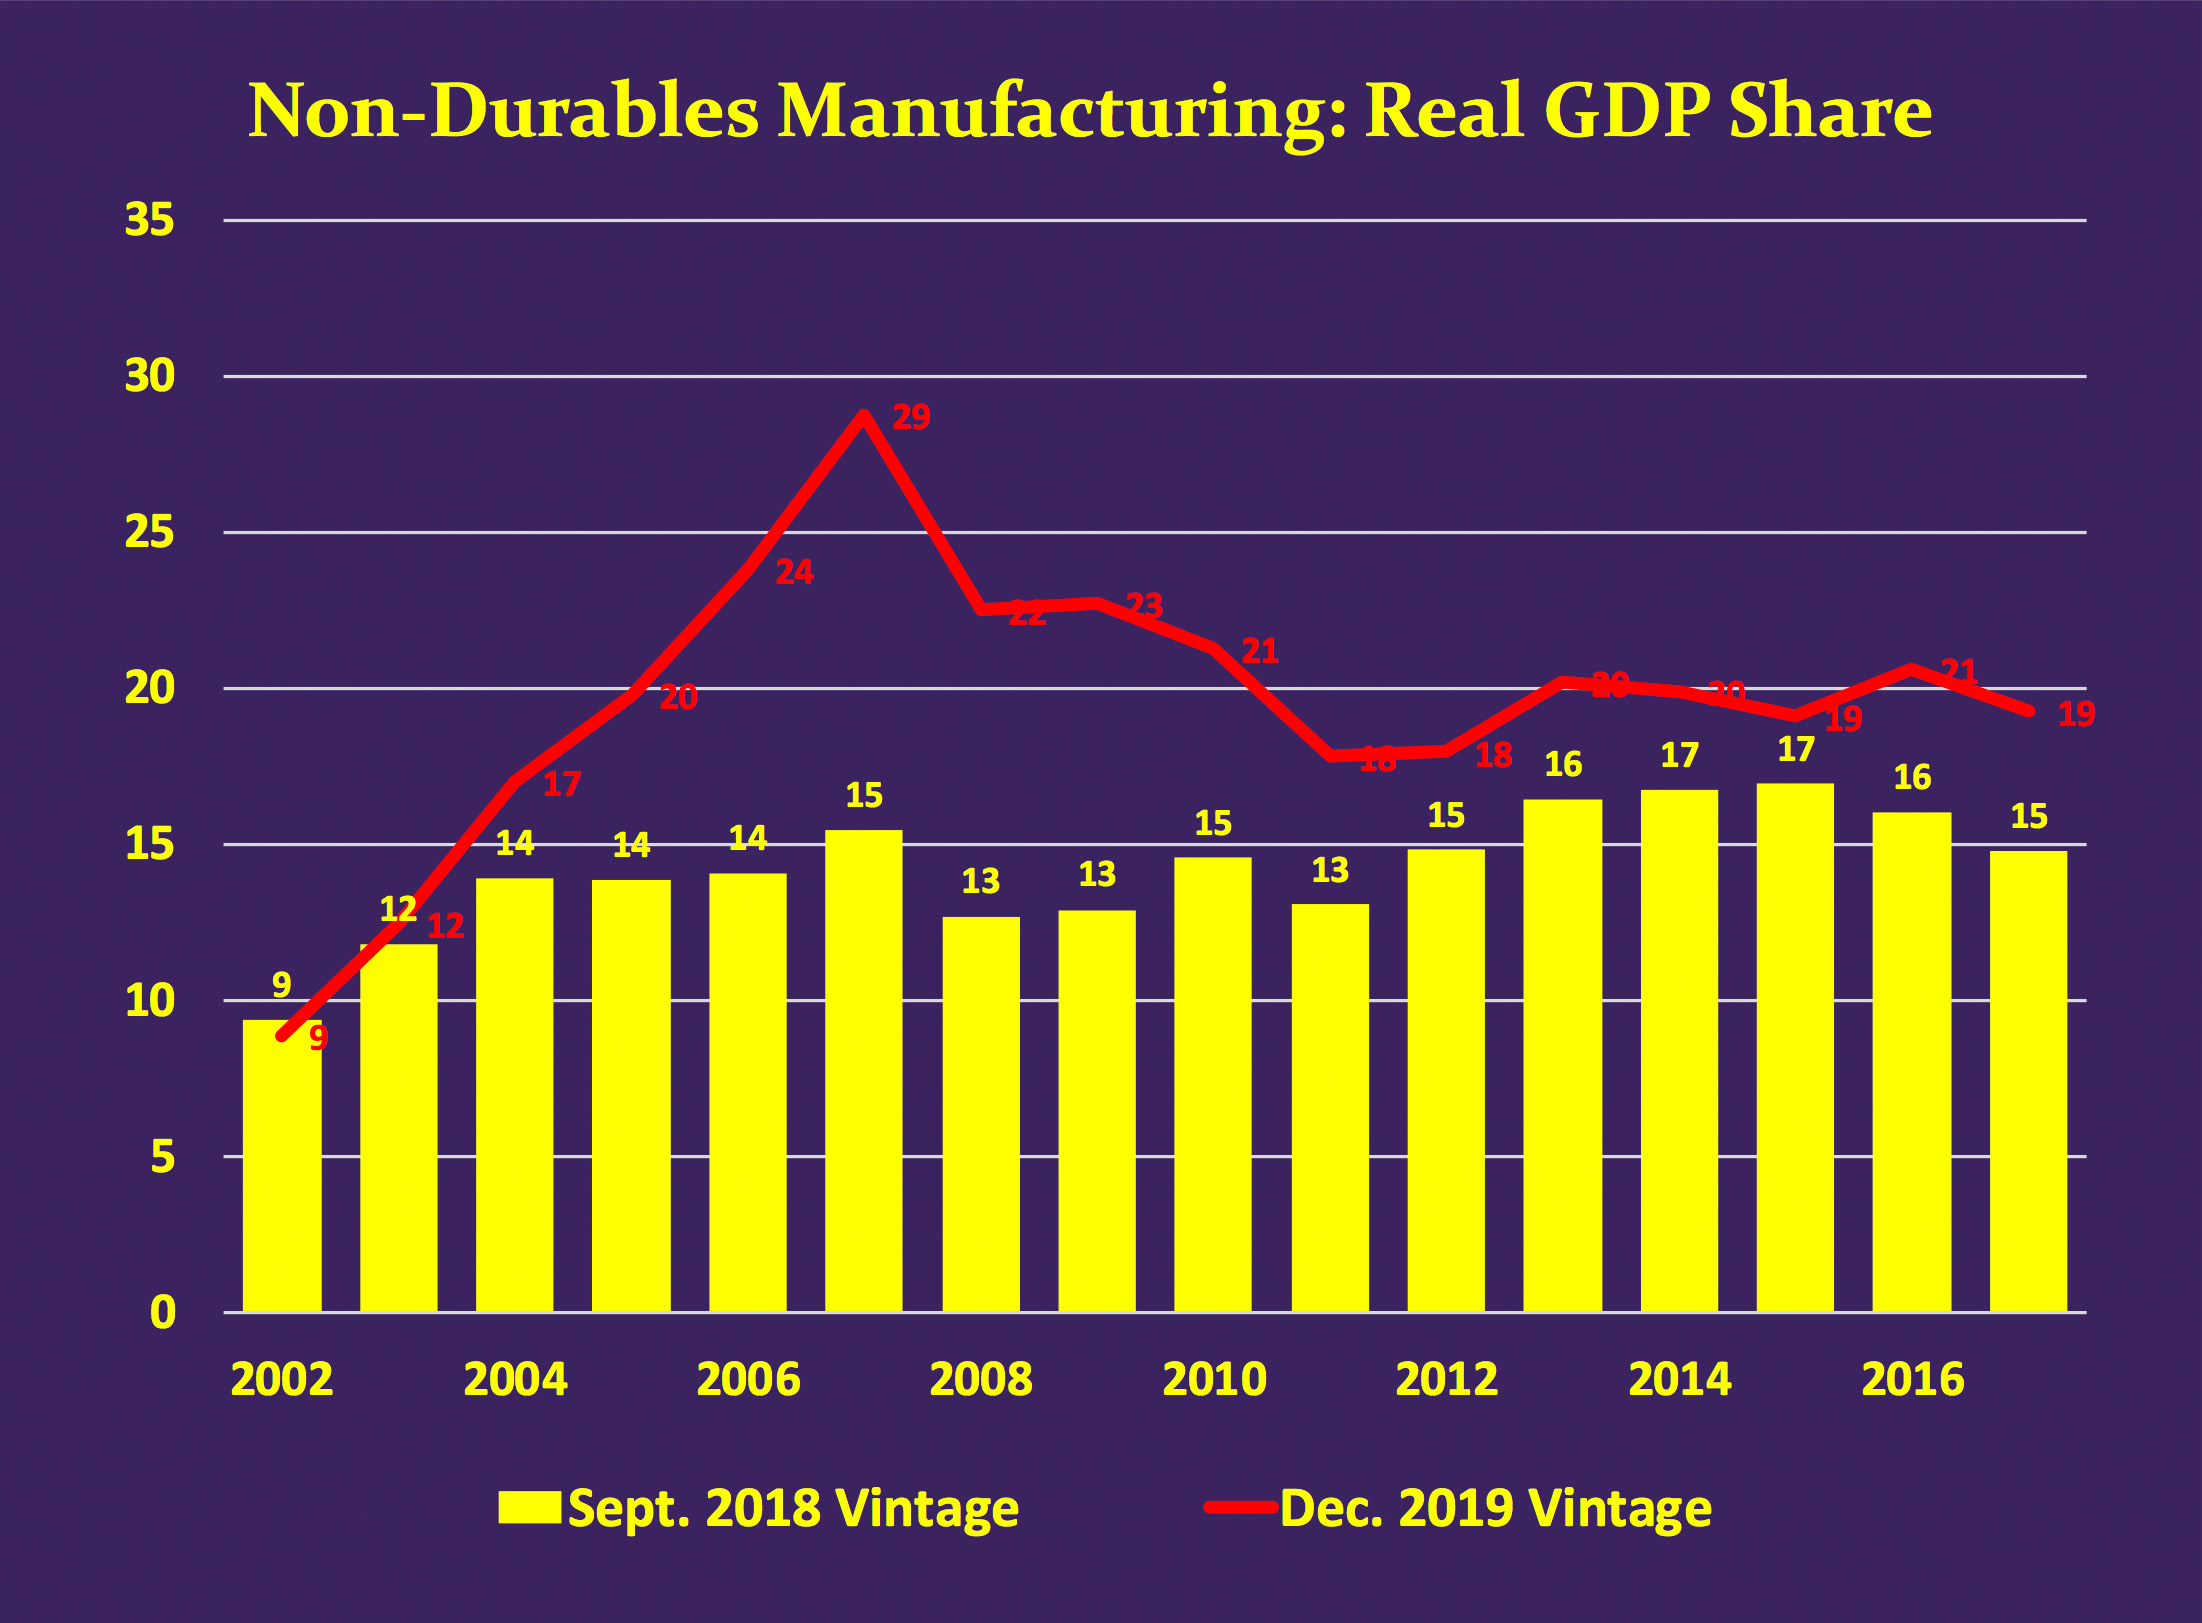
Sectoral data indicate that Ventura County’s economy is much more dependent upon Non-Durable Goods Manufacturing (such as biotechnology) than previously thought. Non-durable goods manufacturing, which in Ventura County is dominated by Biotechnology, is responsible for a much larger share of the County’s total economic output than previously understood. As shown in the table below, the September 2018 vintage of data indicated that Non-durable Goods Manufacturing accounted for 15 percent of County GDP in 2007. Revised data indicate that Non-durable Manufacturing accounted for 29 percent of County GDP in that year. Substantial declines in Non-durable Manufacturing account for a significant share of the County’s GDP contraction in 2008.
Background Note
This year’s release also incorporates data updates and methodology revisions for all of the BEA’s GDP data programs, including national, state and local data. This was a revision process that started with benchmark revisions to national GDP in July of this year. Those revisions filtered down to state level GDP calculations, which were released on November 7. The localization of the revision-process ended with yesterday’s release.
