
CERF Blog
As market-watchers, we are suffering from a serious case of whiplash. The week of March 9 saw five consecutive trading sessions in which the S&P 500 moved at least 4.9 percent between the opening and closing bells. Most dizzying of all, the S&P dropped 9.5 percent on Thursday, March 12 and then increased by 9.3 percent on Friday, March 13. At the time, these represented the biggest single-day loss since Black Monday in 1987 and the biggest single-day gain since the Financial Crisis. And they happened on consecutive trading days. Thursday’s loss was soon eclipsed. On Monday, March 16, the S&P again endured a record decline, this time dropping by twelve percent.
The S&P officially entered a Bear Market on March 12. On that day, the closing price of the index was down more than 20 percent from the all-time high reached on February 19. The Dow Jones Industrial Average entered Bear territory a day earlier, on March 11. The S&P bottomed out on Monday, March 23 with the index standing 34 percent below the February 19 high.
And then, inexplicably, the bulls began to run. Between Monday, March 23 and Thursday, March 26, the Dow Jones Industrial Average surged by 22 percent, officially entering Bull Market territory. The Dow’s Bear Market, which only lasted fifteen days, is the shortest on record and only one-sixth the length of the second shortest Bear Market, which occurred in 1990.
In each case, the dramatic reversal of stock market valuation was not driven by fundamental changes in the economy. In fact, the link between fundamentals and stock prices, if one exists, seems to be reversed. For example, on Thursday, March 26, the U.S. Department of Labor announced that 3.3 million Americans had filed for unemployment benefits during the previous week, dwarfing the previous record. The market promptly rallied, adding nearly 6 percent by the close of trading. Between the open of trading on Monday, April 6 and the market close on Thursday, April 9, both the Dow and S&P added more than 11 percent. This despite the announcement that more than 17 million people had filed for new jobless claims during the previous three weeks.
This disorienting round of extreme market volatility and the obvious disconnection between stock prices and economic fundamentals remind us of the end of 2018. Between October 3 and December 24 of that year, the S&P declined by 19.6 percent. December 24 marked a stunning turnaround. Beginning on December 24, 2018, the S&P began a rapid and sustained increase in value, eventually adding more than 44 percent.
The cause of the late-2018 market turmoil is important to keep in mind as you try to make sense of the current volatility. Very importantly, Federal Reserve policy is as much to blame for market bedlam as any viral pandemic.
The dramatic rise in stock prices since at least 2016 has been driven by the Fed’s policy of ultra-low interest rates. The lack of a real positive return on safe investments such as Treasuries has driven investors into stocks, in search of yield. This was the Fed’s explicit (and we would say myopic) intention.
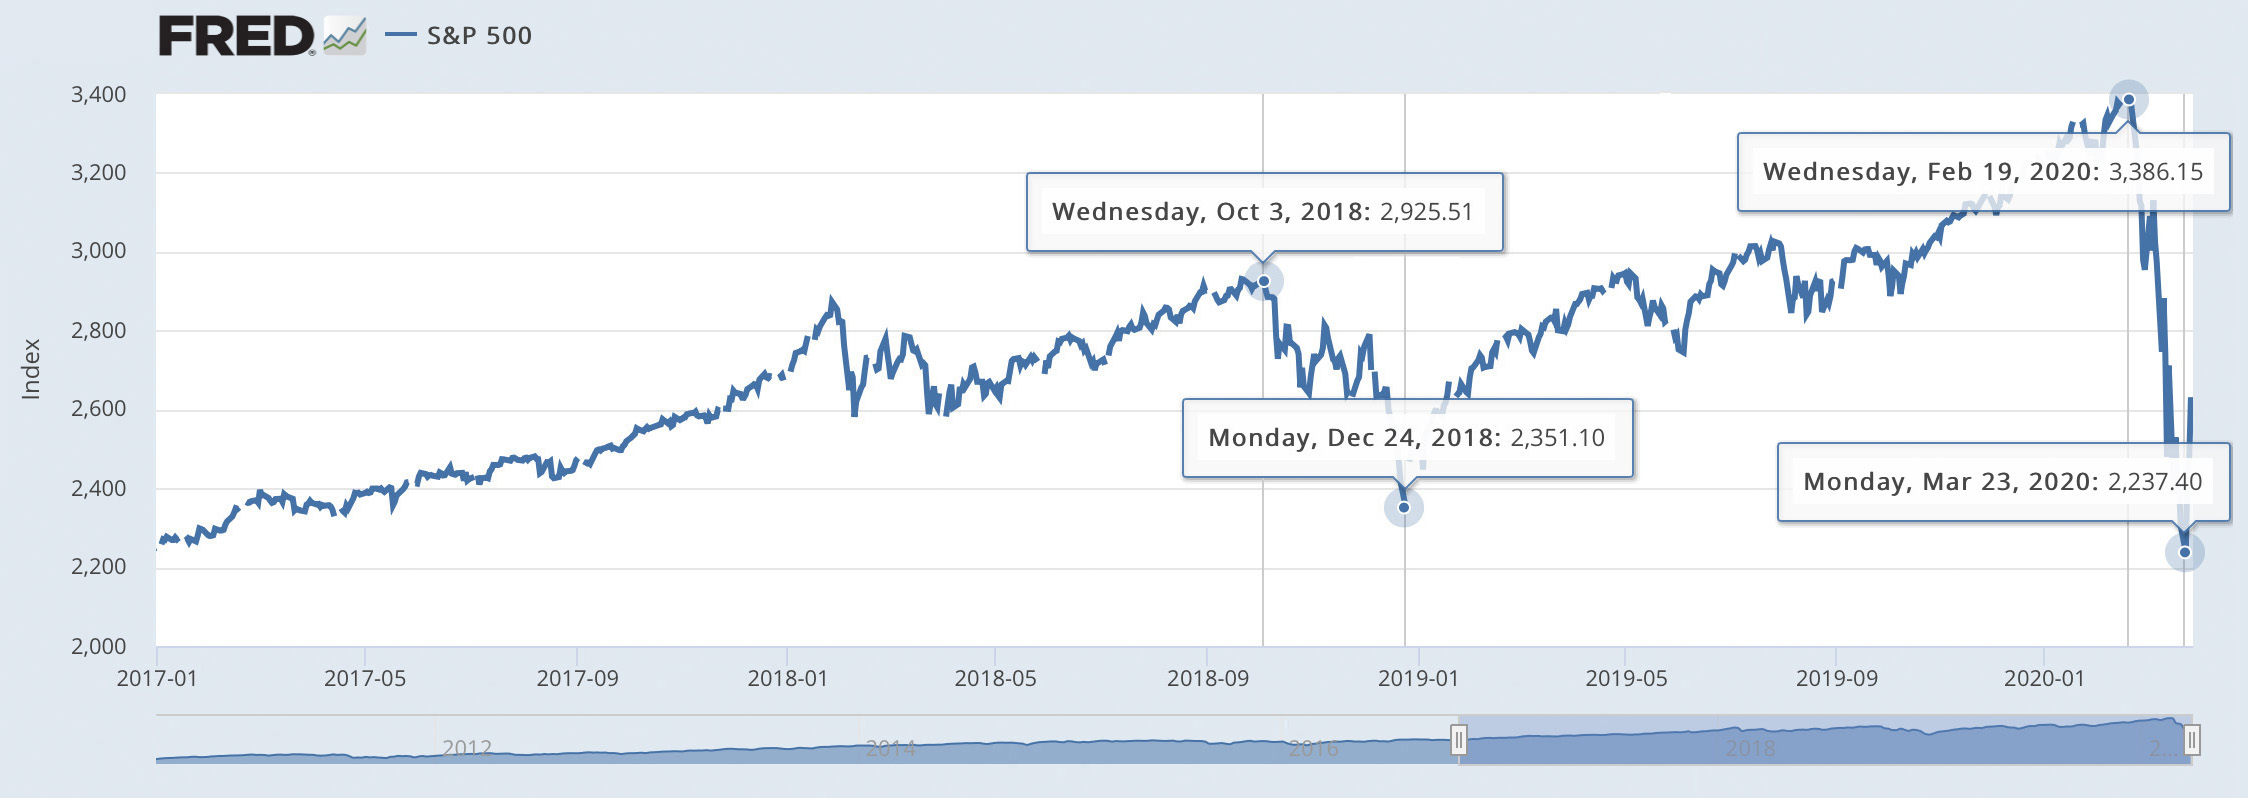
The announcement by the Fed on October 3, 2018 that ultra-low interest rates were coming to an end drove nearly 20 percent of all investment dollars out of stocks and into safer and suddenly more-attractive assets. The announcement of a policy reversal in January 2019, that ultra-low interest rates would continue indefinitely, drove those same investment dollars, and trillions more, back into stocks. The 44 percent climb that the S&P enjoyed over the 13 months that followed happened during a time when the broader economy was experiencing a dramatic erosion in the growth outlook as a result of trade policy. In other words, stock prices have been disconnected from economic fundamentals since well before the coronavirus outbreak.
Does that mean we can characterize the recent stock market high as a bubble? We hesitate to call the run up to the February 19 stock market high a Fed-induced asset bubble, but it’s hard to call it anything else (a small-bubble, a bubblette?). Even following the dramatic 34 percent decline in stock valuations in March, the S&P has only spent two days at a level lower than the December 24, 2018 closing price low. As of this writing, the S&P sits ten percent above that level.
All of this leads us to believe that the floor of a true market correction is probably at least 10 to 15 percent below the December 2018 low of 2,351. Fifteen percent lower would put the index right around the 2,000 level. This may shock some of our readers, especially any needing to access their 401(k)s in the near future. But we regard this as a realistic view of the perverse impacts that monetary policy is having on markets and the potential impact of social distancing and the resulting economic contraction.
It follows that the dramatic climb of stock prices between March 23 and 26 and again between April 5 and 9 is not a positive sign, in our estimation. The extent to which Federal Reserve interventions re-inflate asset prices will only make the coming correction even more severe. Nothing re-unites market prices and economic fundamentals more effectively than a serious recession. What the Great Recession did for home prices, the Coronavirus Recession might well do for stocks.
Sure, blame the virus for market volatility, but first blame the Federal Reserve for driving a wedge between stock prices and underlying economic fundamentals. Any stock market crash that accompanies the Coronavirus Recession will bear the Fed’s finger prints.
