
CERF Blog
The Coronavirus Recession
The Coronavirus is now understood to be having a stunning impact on the U.S. economy. The suspension of economic activity resulting from social distancing and shelter-in-place orders issued across the nation is simply breathtaking. One of the earliest data points to arrive was new jobless claims. Nearly 17 million people have filed for initial claims during the past three weeks. The week of March 27 saw 3.3 million new claims, a number nearly five times the previous record set in 1982. The week of April 3 saw 6.9 million new claims, nearly 15 times the 1982 record. Even as we await the arrival of additional data points, it is not too early to declare that we are experiencing a historic and life-changing event. The United States has entered a deep recession as a result of the coronavirus and the extraordinary policy responses intended to slow the disease.
Given uncertainty about the trajectory of disease transmission and the duration of social distancing and shelter-in-place orders, the CERF team has developed a range of scenarios, including a baseline forecast and an optimistic scenario. The primary driver of our scenarios is not the rate of disease transmission, directly, but rather the duration of shelter-in-place orders. If those orders last long enough to drive a large number of small businesses into insolvency, then given the plight of hourly workers, lower-income families and other economically vulnerable people impacted, we may even experience what can rightly be called a Depression.
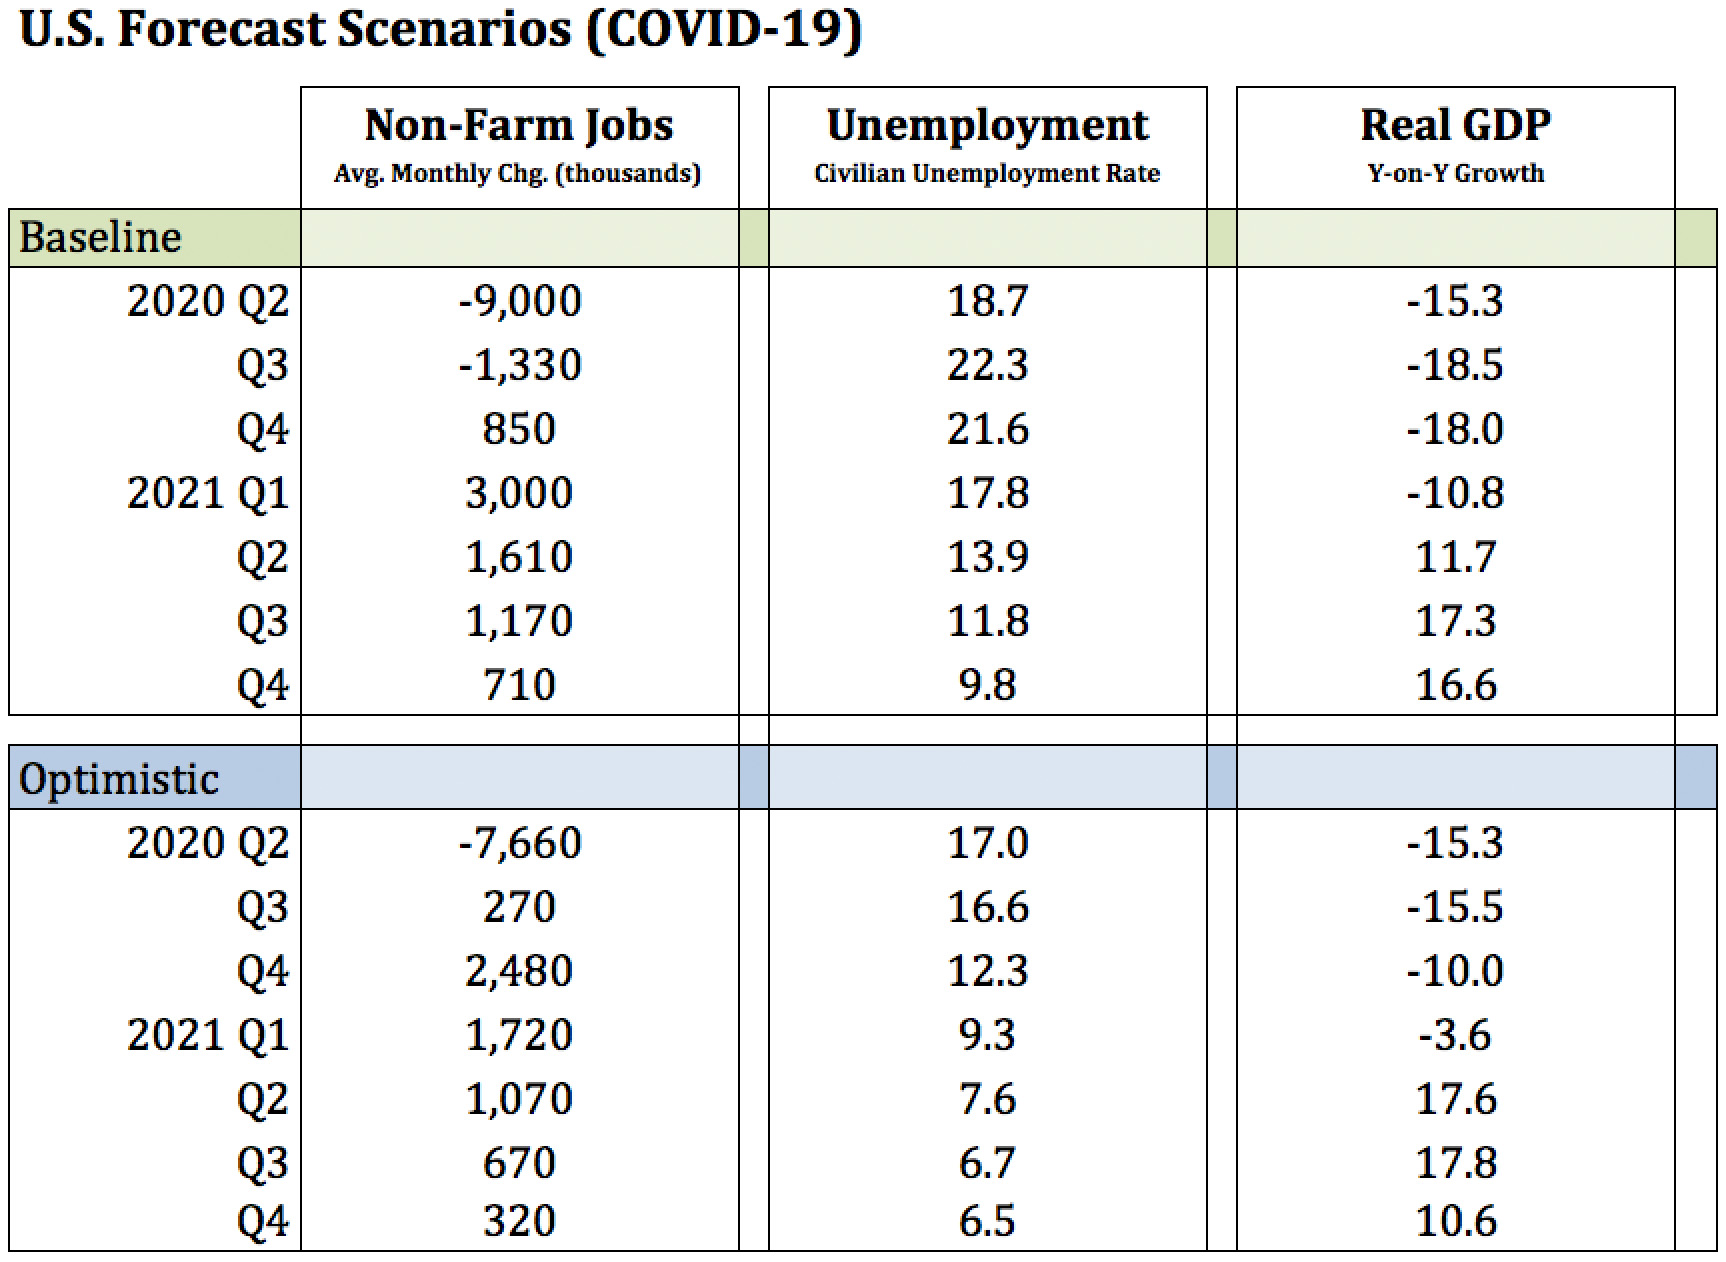
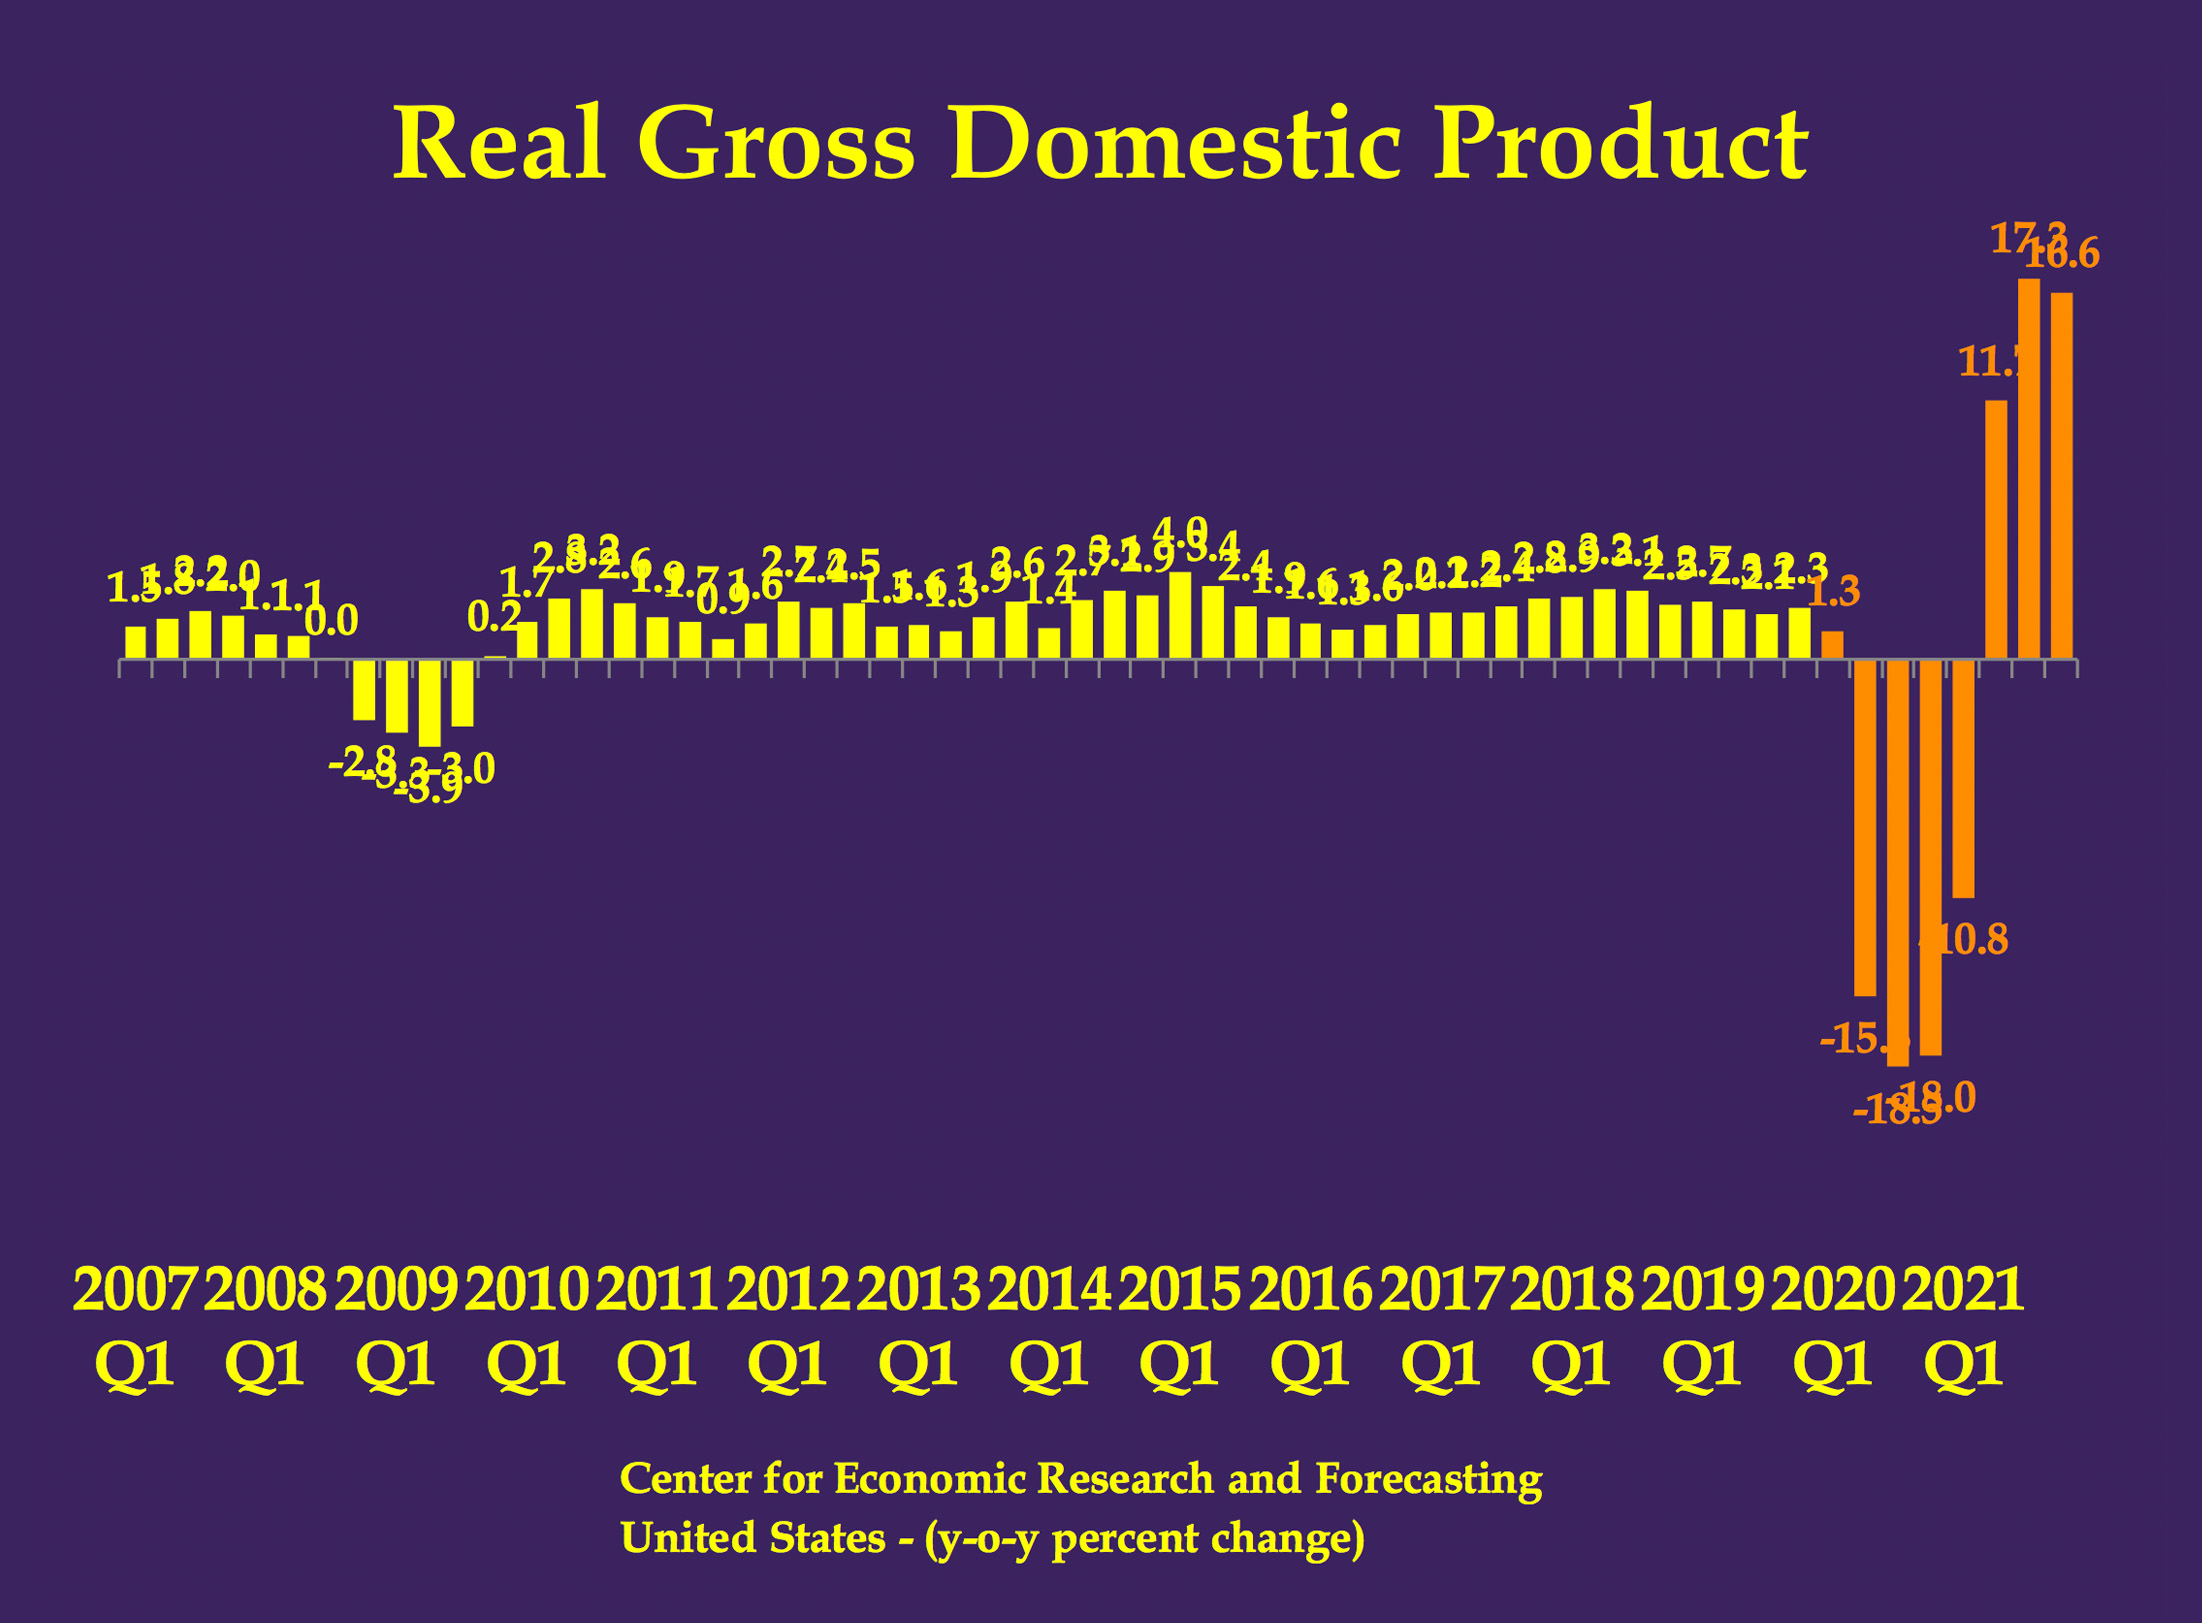
CERF’s baseline forecast anticipates second quarter year-on-year GDP growth of negative 15 percent, followed by two quarters of negative 18 percent growth. Economic decline of this magnitude makes the so-called Great Recession look like a minor downturn. The worst year-on-year decline of that crisis was only negative four percent, in 2019 Q2. The baseline’s implied quarter-on-quarter annualized growth rate is staggering: negative fifty percent in Q2. Plainly, there is no economic contraction in the post-World War II era which compares to the current crisis.
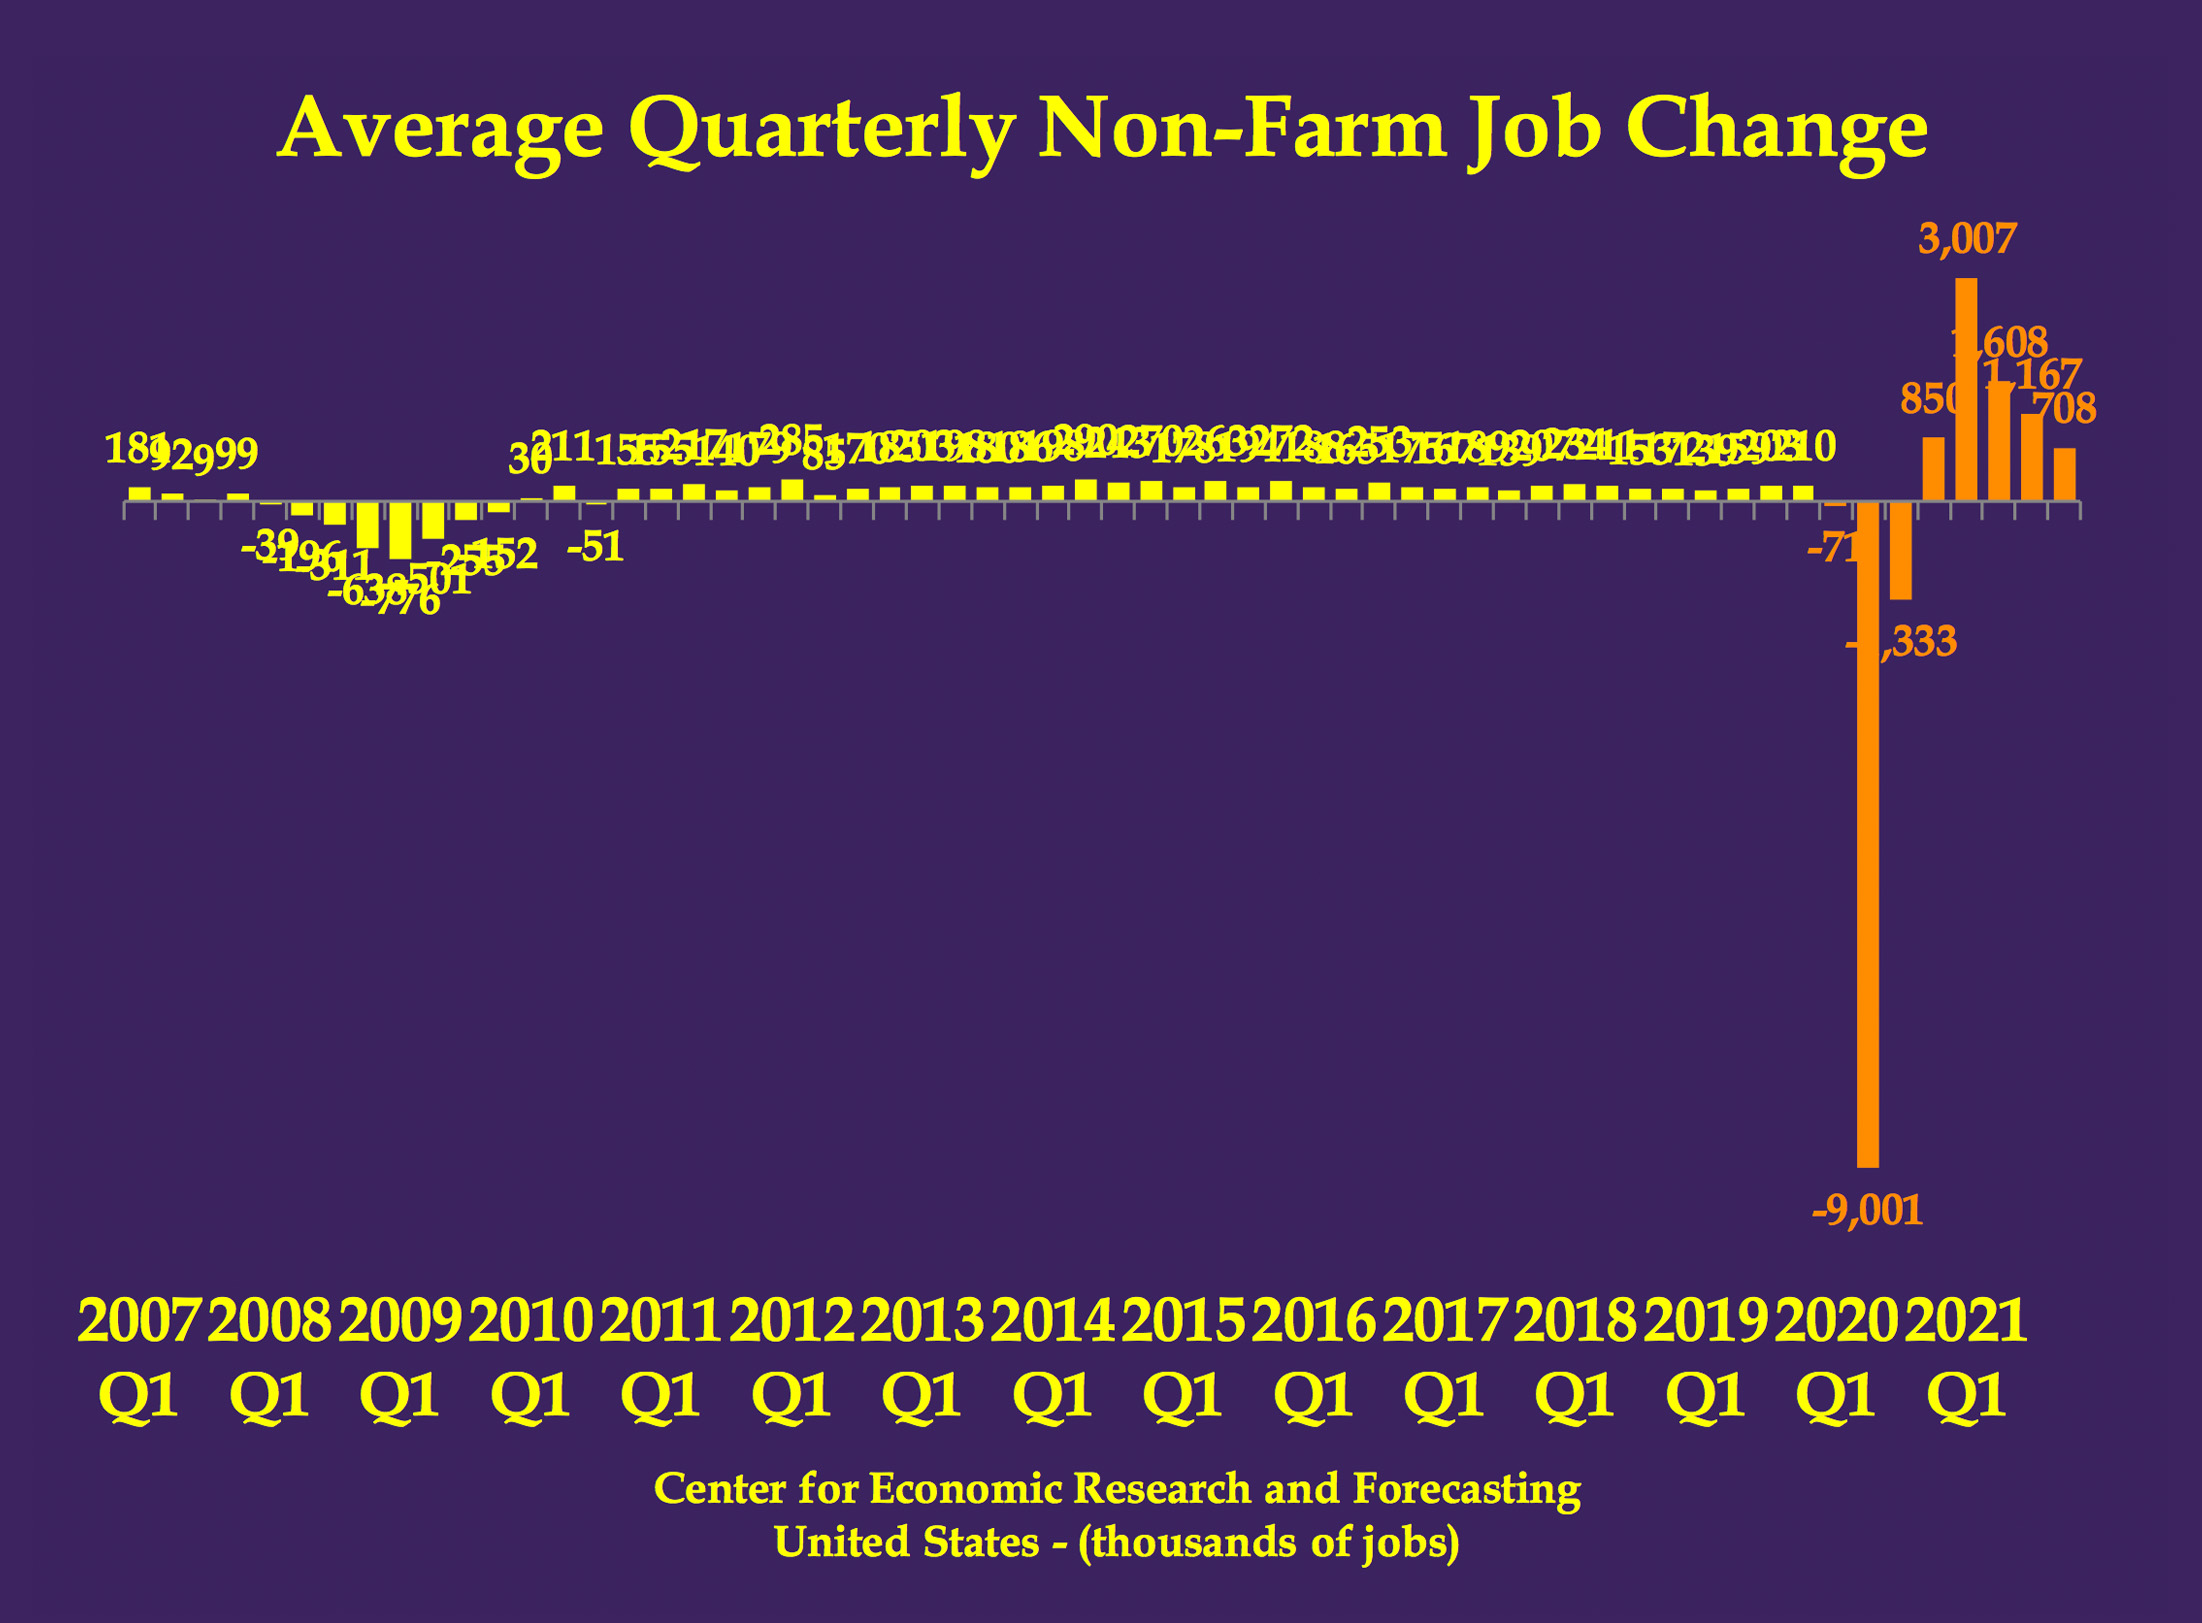
We anticipate average monthly losses of 9 million jobs during the second quarter of 2020. Once again, job losses under this scenario dwarf anything experienced since the Great Depression. During 2009 Q1, the worst quarter of the Great Recession, the United States lost an average of only 776,000 jobs per month. All told, we expect nearly 30 million jobs to be lost before the end of the year.
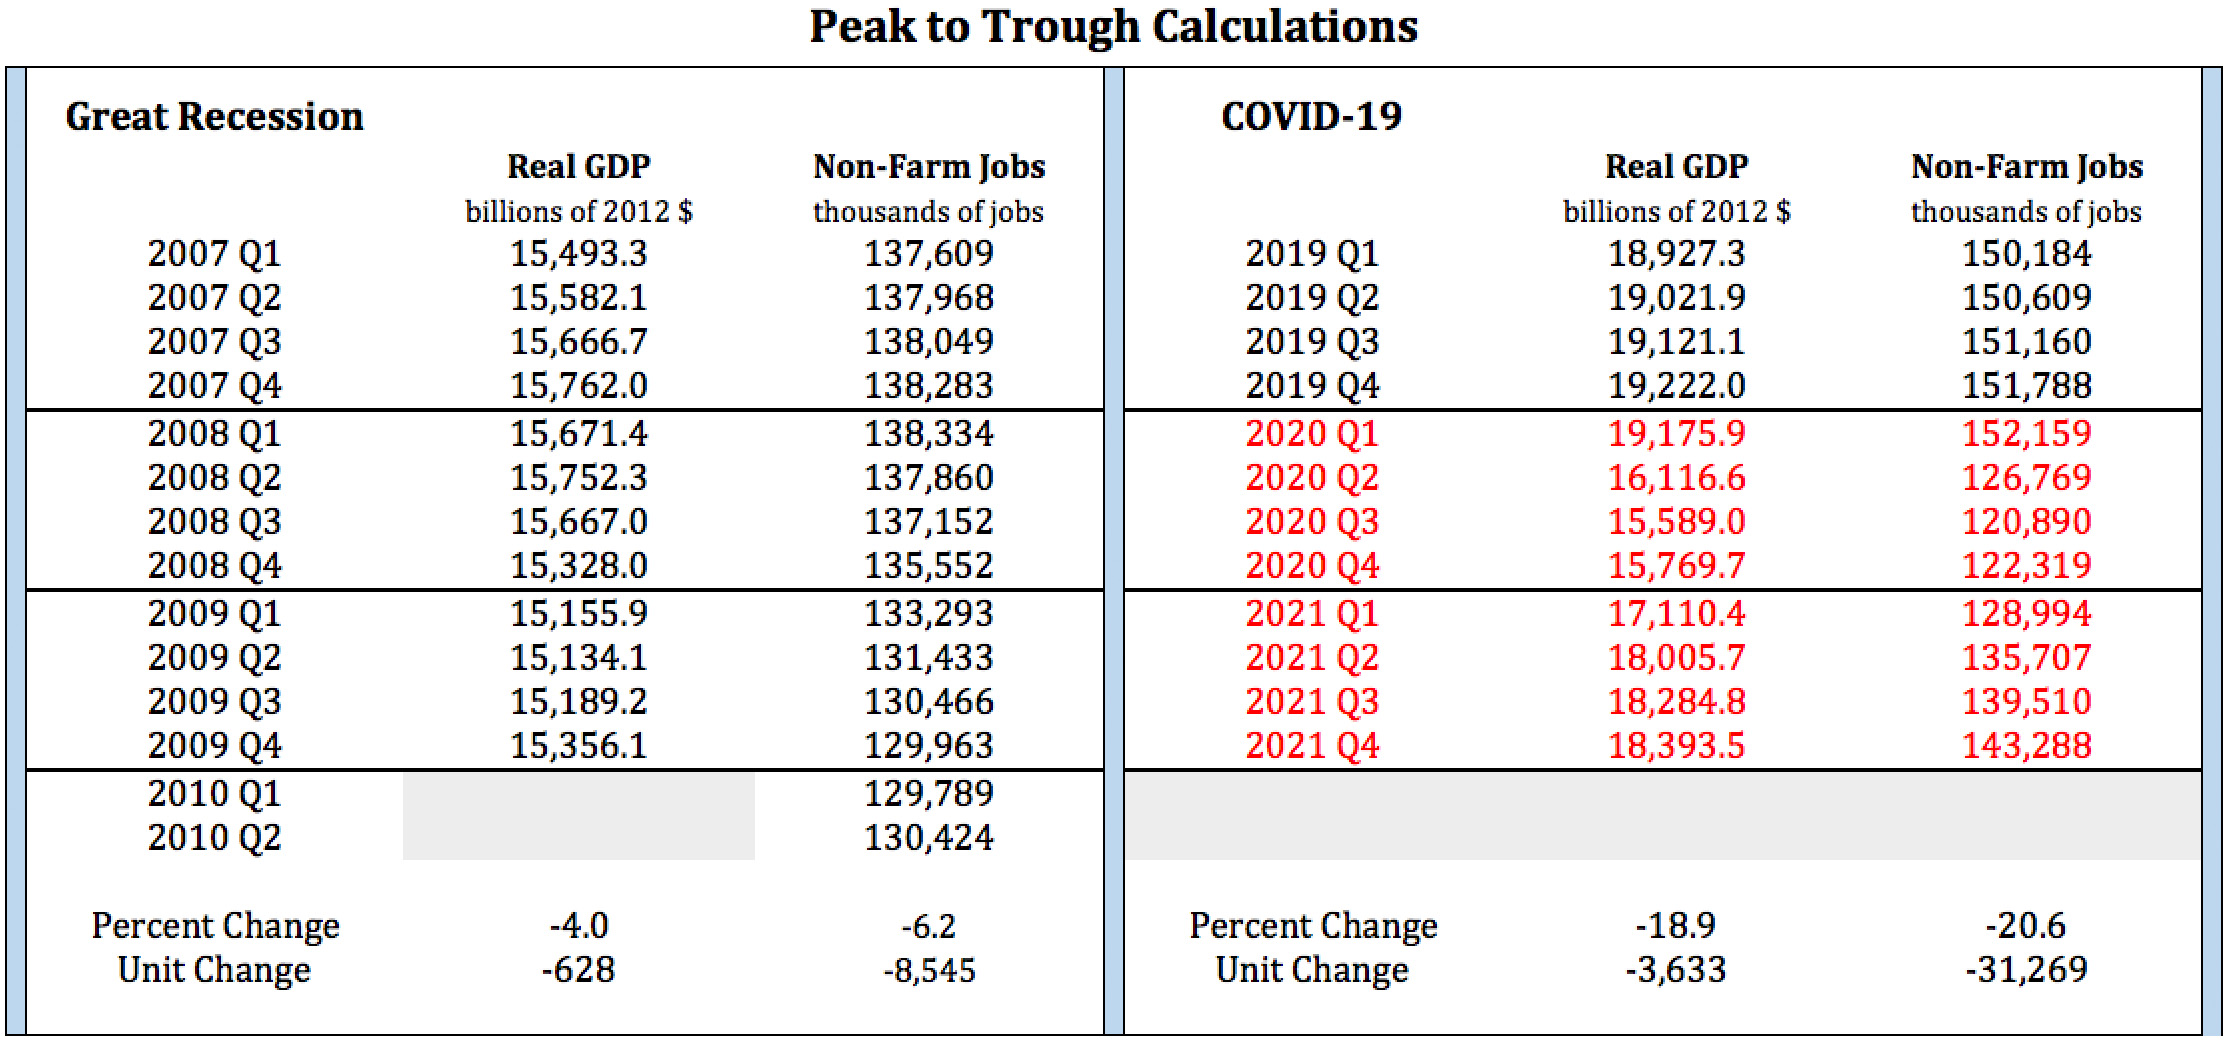
Under the baseline forecast, from peak to trough, we anticipate that U.S. GDP will contract by around 20 percent. In contrast, from the peak of economic activity in 2007 Q4 to the trough of the Great Recession in 2009 Q2, U.S. GDP contracted by only four percent. During the Coronavirus Recession, we anticipate an initial decline of approximately 17 percent by the end of Q2, driven entirely by the policy-induced shutdown of large segments of the economy. We predict that this will be followed by a second, smaller decline in output in the third quarter, this time caused by a wave of small business failures which result from government mandated closures. Critically, CERF’s baseline forecast assumes that most shelter-in-place orders will extend well into May and will not be lifted in time to prevent these business failures.
CERF economists are among the 45 percent in a recent Wall Street Journal survey who are predicting a “U-shaped” recovery, with a prolonged economic trough and a slow and painful recovery.
CERF’s optimistic scenario hinges on a dramatic flattening of the disease transmission curve and a significant increase in political courage on the part of policy makers. The optimistic scenario requires that shelter-in place orders be lifted at the end of April, only three weeks from the date of this writing. We believe that a May 1st re-opening of the economy would provide a fighting chance for American small businesses and their employees.
Our optimistic scenario anticipates a peak-to-trough GDP decline of only 17 percent. As with the baseline forecast, it anticipates a 17 percent decline of GDP during the second quarter but assumes that there will not be additional contraction in the third quarter as small businesses begin to reopen and recovery begins.
The importance of quickly lifting social distancing and shelter in place orders should not be underestimated. According to a 2016 survey of 600,000 small businesses by the J.P. Morgan Chase Institute, fewer than half of small businesses hold cash buffers large enough to endure a 30-day shutdown. Even with the $350 billion small business lending program authorized by Congress, large numbers of small businesses may begin to go under beginning in May. Delays in implementing loans to small businesses indicate to us that even a rapid end to shelter in place orders may not be enough to enable our optimistic scenario.
In this way, the decision confronting policy makers in the face of the coronavirus is complex. They must simultaneously balance the transmission rate of the disease with the transmission rate of the impacts of various government responses to the disease. In doing so, policy makers must balance the livelihood of people vulnerable to the virus against the livelihood of economically vulnerable people. The policy responses to the spread of the coronavirus have already initiated a historic economic contraction. The situation necessitates lifting shelter-in-place orders at the absolute earliest moment, when the spread of disease might no longer overwhelm our healthcare system. And not a moment later.
A note on annualized growth calculations
U.S. GDP growth is calculated by the Bureau of Economic Analysis and reported, often breathlessly, by journalists as a quarter-on-quarter (q-on-q), seasonally adjusted and annualized rate (SAAR) of growth. Annualization is accomplished by calculating what the annual growth rate would be if the quarter’s rate of GDP growth were to persist for an entire year.
As mentioned previously, the combination of a forecasted 17 percent decline in the level of output in the second quarter of 2020 and the lack of a rapid rebound in CERF’s forecast produces truly shocking annualized growth forecasts. CERF’s prediction of real SAAR GDP growth for Q2 is negative 50 percent. Although annualized growth calculations are the favored statistic among government agencies and financial journals alike, we find them to be deeply misleading.
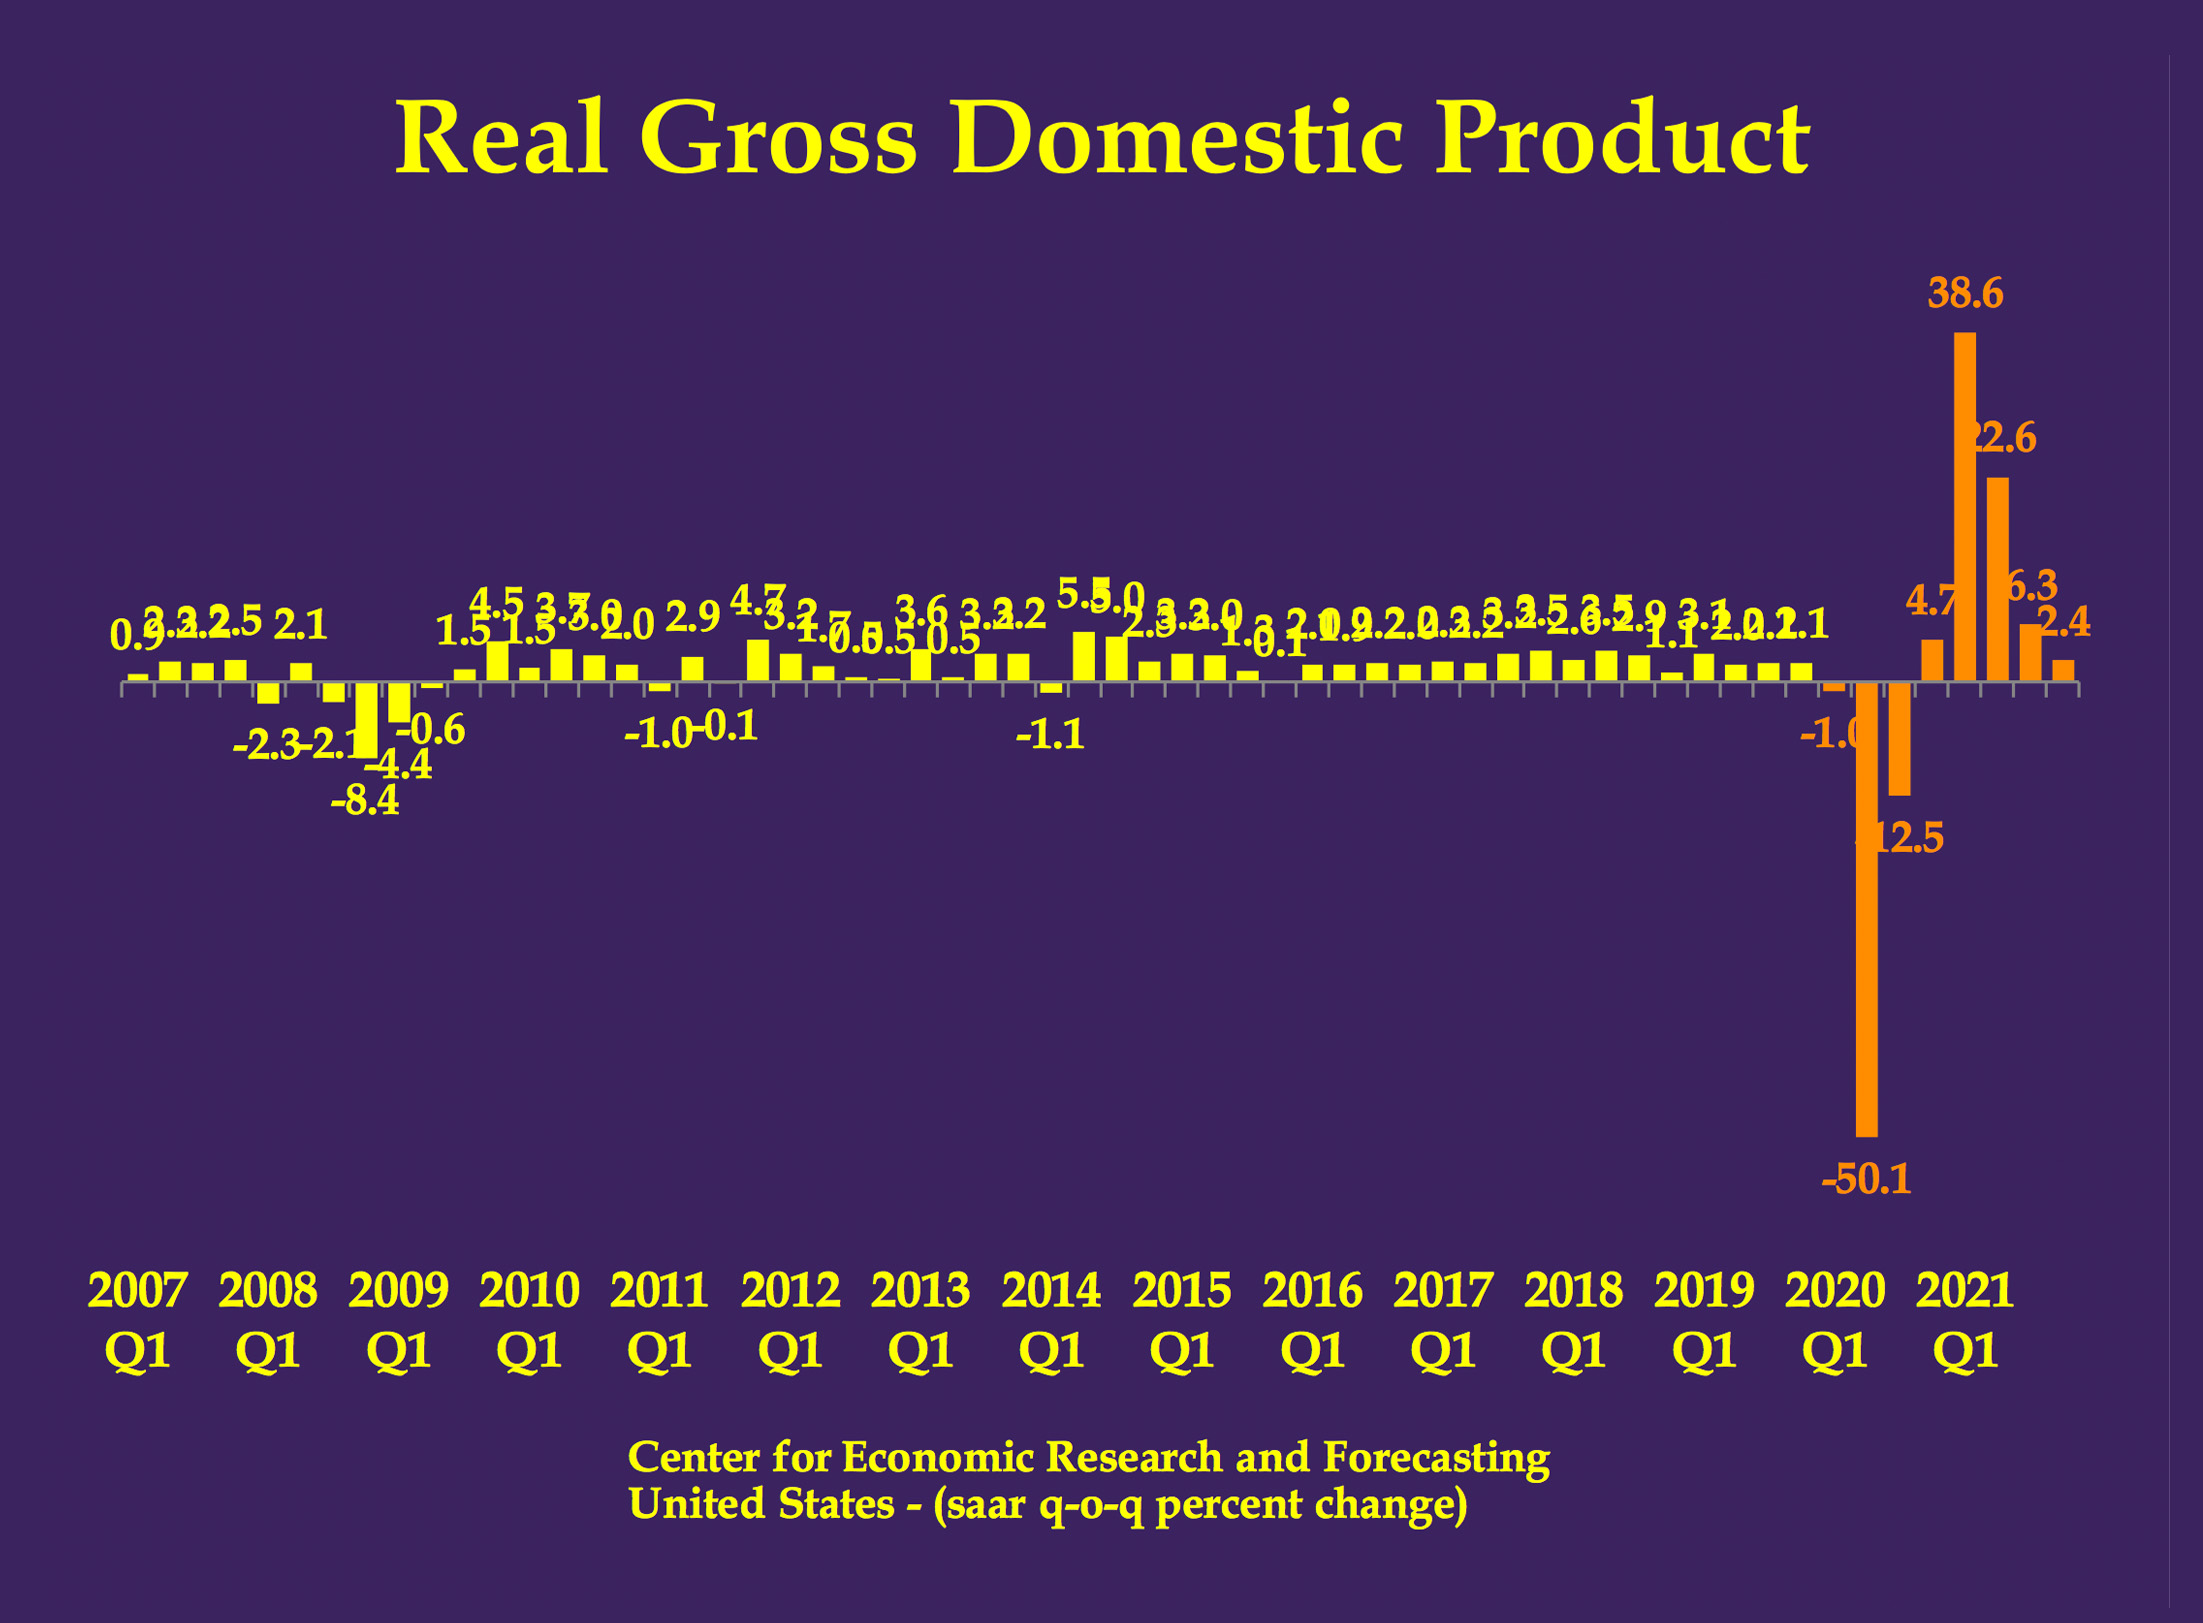
Consider that, following detailed analysis commissioned by the Wall Street Journal, Moody’s Analytics is predicting a peak-to-trough decline in U.S. GDP of approximately 29 percent. Moody’s forecast is nearly 10 percentage points (50 percent) more pessimistic than the CERF peak-to-trough forecast. Yet, Moody’s is predicting q-on-q SAAR growth of only negative 30 percent in Q2. Underlying Moody’s forecast is the assumption that U.S. GDP will contract by 29 percent in April, remain steady in May and then grow by 30 percent in June. This would represent an extreme V-shaped recovery, with 92 percent of economic activity being restored by July 1. Assuming an U-shaped recovery would push Moody’s implied q-on-q SAAR growth estimate down to negative 75 percent.
We find the analysis which led Moody’s to predict a 29 percent decline in output to be very credible. In fact, the county-by-county and sector-by-sector analysis that Moody’s conducted is the most thorough analysis of the current economic situation that we are aware of. However, the belief that an unprecedented contraction in economic activity can be followed by such a rapid recovery seems implausible to CERF economists. Economic dislocation of the kind that has been created by government mandated business closures simply can not be undone in a month or two. Our best guess is that we will be living with the economic consequences for years to come.
To be clear, CERF is predicting a GDP decline less sharp but more enduring than the forecast put forward by Moody’s. And you would never know this by comparing forecasts of quarter-on-quarter annualized growth.
