
CERF Blog
The BEA released its “advance”, or first, estimate of second quarter GDP today, and it might not surprise anyone that the economy grew more slowly in the second quarter than in the first quarter. The question is: how much slower? The quarter 2 estimate is 1.5 percent, compared with a revised estimate of 2.0 percent for quarter 1. We had forecast 1.2 percent, while the Wall Street Journal consensus as of the second week of July was 1.7 percent.
Consumption growth dropped a bit, from 2.4 percent in quarter 1 to 1.5 percent in quarter 2. Fixed investment growth fell from 9.8 percent to 6.1 percent, driven by substantial slowdowns in commercial and residential building investment. Inventory investment rose from $56.9 billion to $66.3 billion. Net exports fell from a decline of $416 billion to a decline of $424 billion. Government expenditures declined 1.4 percent in quarter 2 compared with a 3 percent decline in quarter 1.
The initial data for quarter 2 are similar in spirit to our quarter 2 forecast published June 28, where our forecast called for a bit more of a slowdown. In particular, we forecasted the strength of consumption and fixed asset investment in real estate in quarter 1 would slow down in quarter 2, and it did.
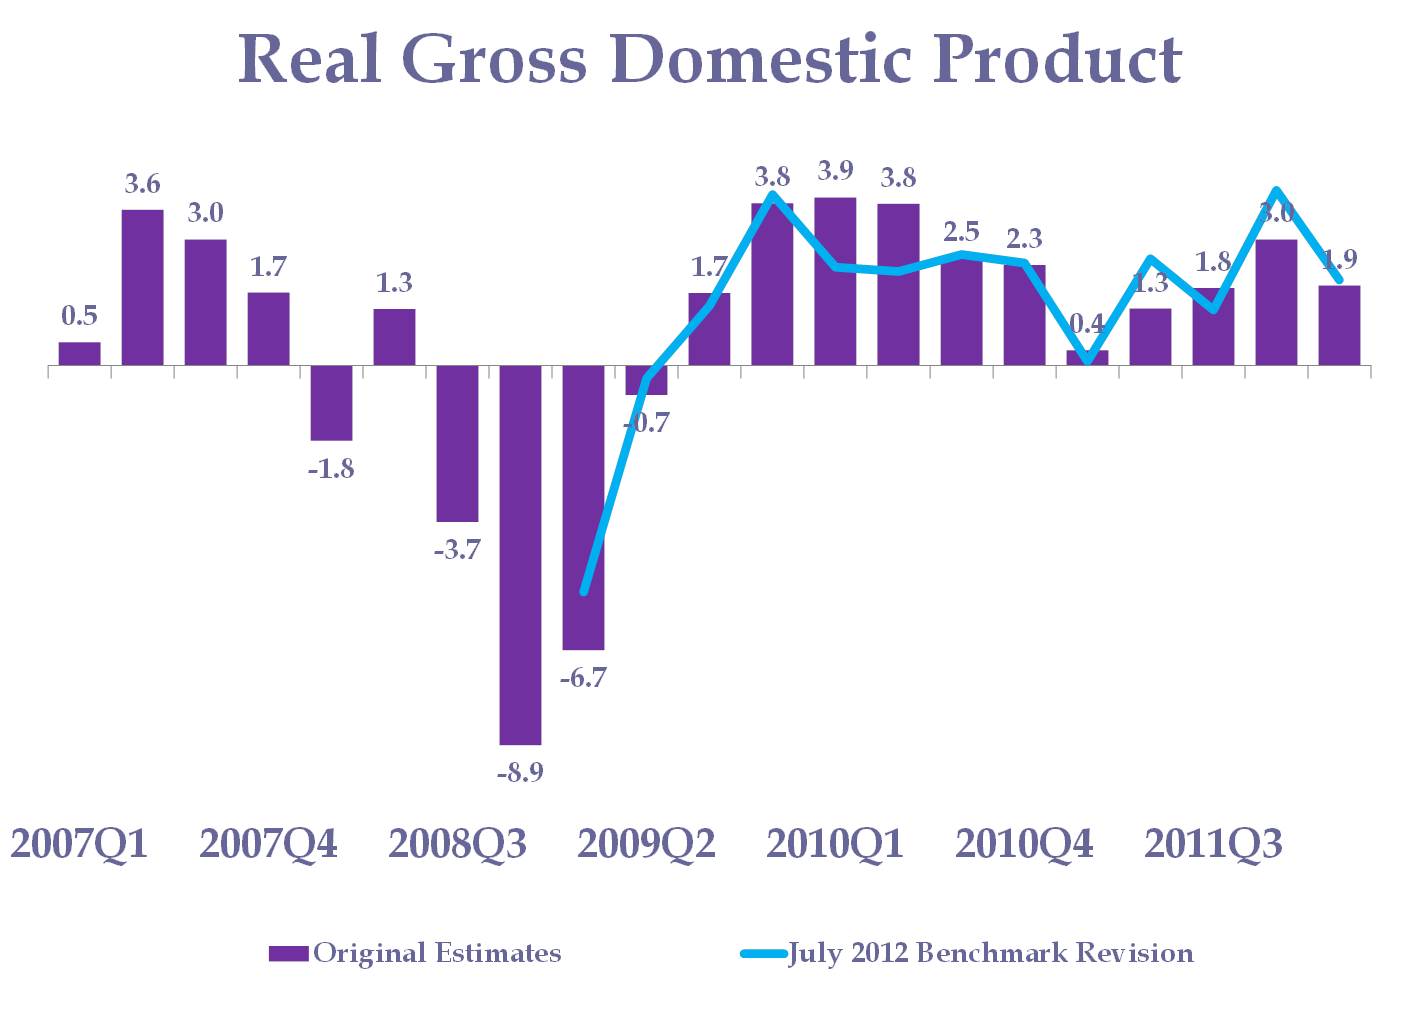
The BEA also revised GDP estimates and related data back to 2009. I provide a chart of the revisions at the quarterly time-frame at the end of this blog. The largest impact was on 2010, where the strength of the economy appears to have been over-estimated in the first half of that year. 2009 was revised up by four tenths of a percent and 2011 was revised down by one tenth. The results of these revisions on the annual real GDP data are shown here:
United States Economic Growth Rates: Original Estimates vs. Revisions
Year | 2009 | | 2010 | | 2011 |
Previous -3.5 3.0 1.7
New -3.1 2.4 1.8
Units: seasonally-adjusted annualized growth rates
Source: U.S. Bureau of Economic Analysis

