
CERF Blog
Corporate bond spreads are returning to normal levels. The first chart below shows that the monthly spread between Baa bonds and Aaa bonds are close to what they were back in 2007 before the 2008 crisis. This is good because the rate on Baa bonds is declining. This indicates that the perceived risk in lower quality bonds is falling.
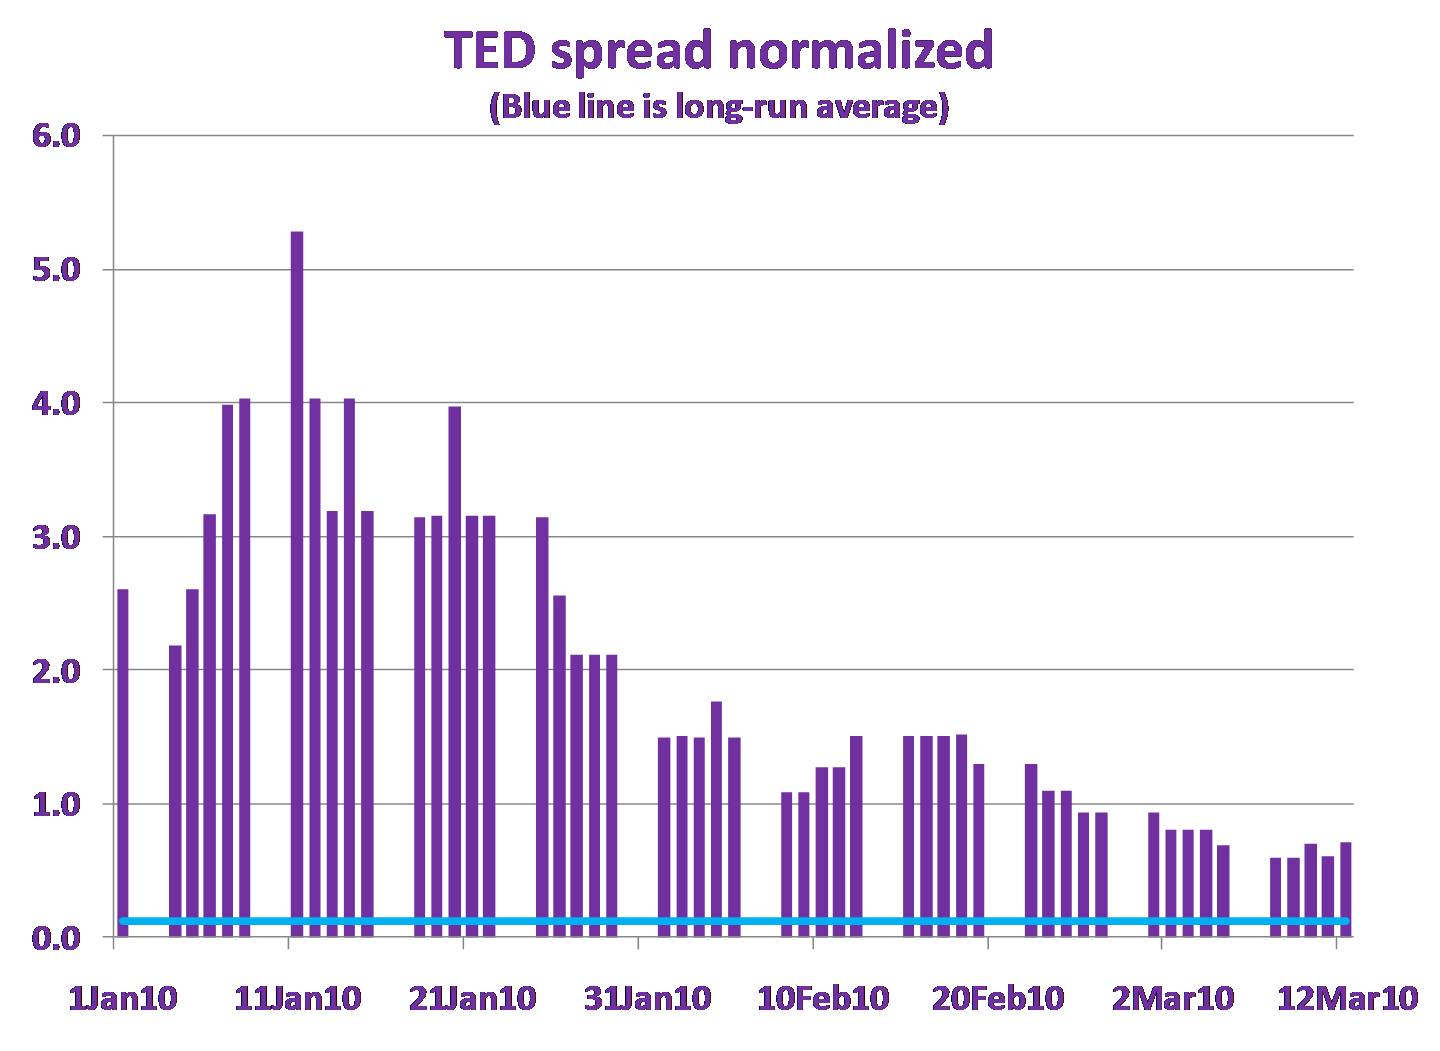
However, not all spreads are back to normal. The second chart below shows daily normalized Ted spread, currently at 0.64, is still not very close to the long-run average of 0.12. The normalized Ted is the Ted divided into the 3-month United States Treasury rate. We do this because a Ted spread of 0.25 is a very different thing when the 3-month rate is 0.20 compared to when it is 0.40. The normalized Ted reached 200 in the depths of the crises. It rose again early this year, reaching a level just over 5, when the prospect of Greece defaulting became publicized. Everything is relative and this is a particularly good example. It is good that this measure is 0.64 rather than 5 or 200, and it is declining. Again, this indicates that the perceived risk of non-Treasury bonds is falling.
As with diverse indications from various measures of real economic activity, various fixed-income indicators are showing that certain aspects of financial markets are returning to normal which is a welcome sign indeed.


