CERF Blog
I discussed three stylized possible equilibria for the United States economy in a July 18 blog. The best equilibrium, one with rapid job and GDP growth and low inflation was relegated to an unlikely possibility at this time. The worst equilibrium of the three, the “bad-deflation” scenario, was one where debt-laden and cash-strapped consumers hold off on purchases en masse, thus causing a large fall in the 71% component of GDP that is consumer spending.
I argued that the United States economy is now in an intermediate equilibrium, one I call the “good-deflation” equilibrium. This is where consumers see low price growth as helpful in maintaining moderate spending in a jobless economy, producers see low price growth as helpful in maintaining costs, and the FED is able to maintain historically low interest rates without worrying about inflation.
What are the factors that might drive an equilibrium shift from today’s good-deflation equilibrium to a bad-deflation equilibrium? We need factors that measure how people feel. We would like to know how households view their current economic situation, how firms view their current situation, how banks view their situation, and how investors might view the future.
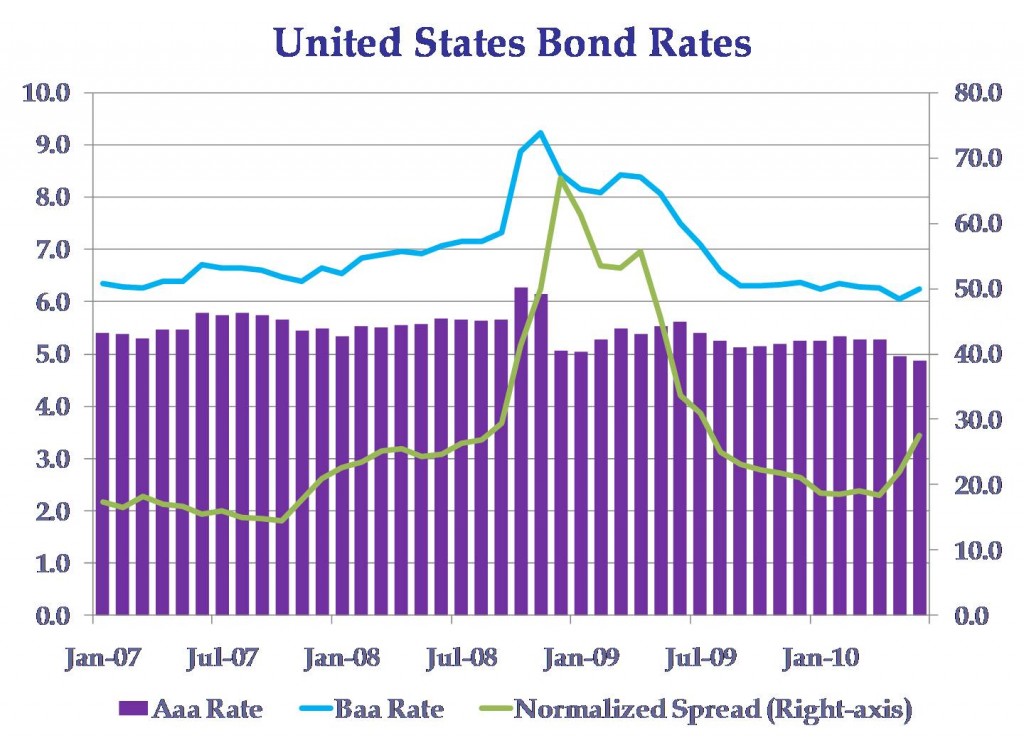
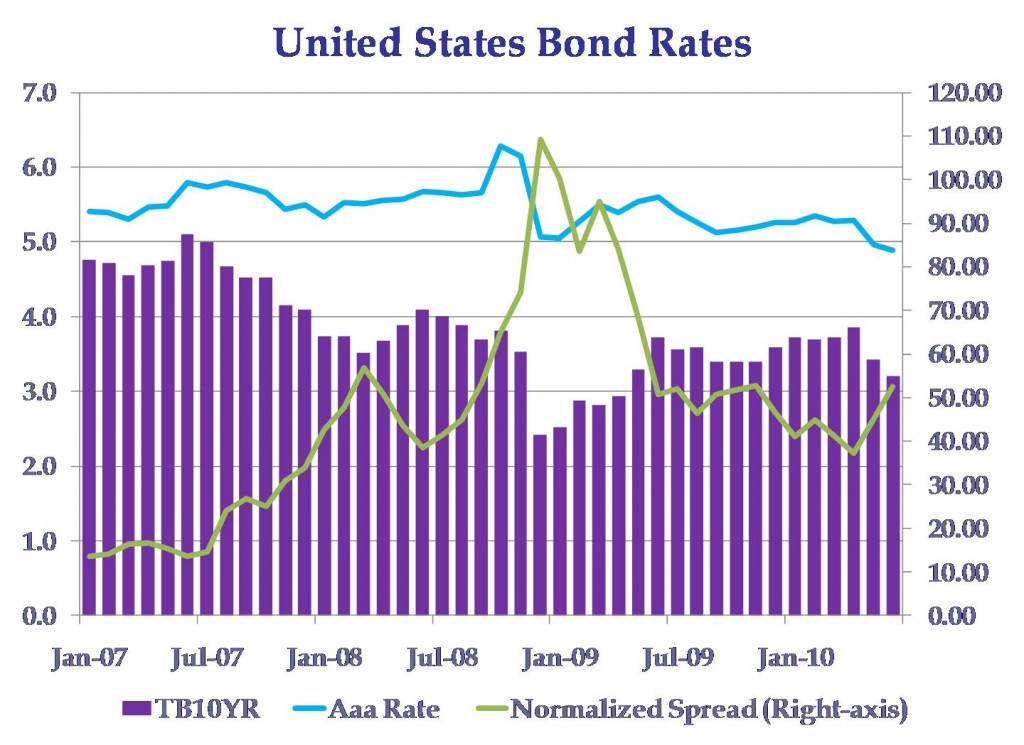
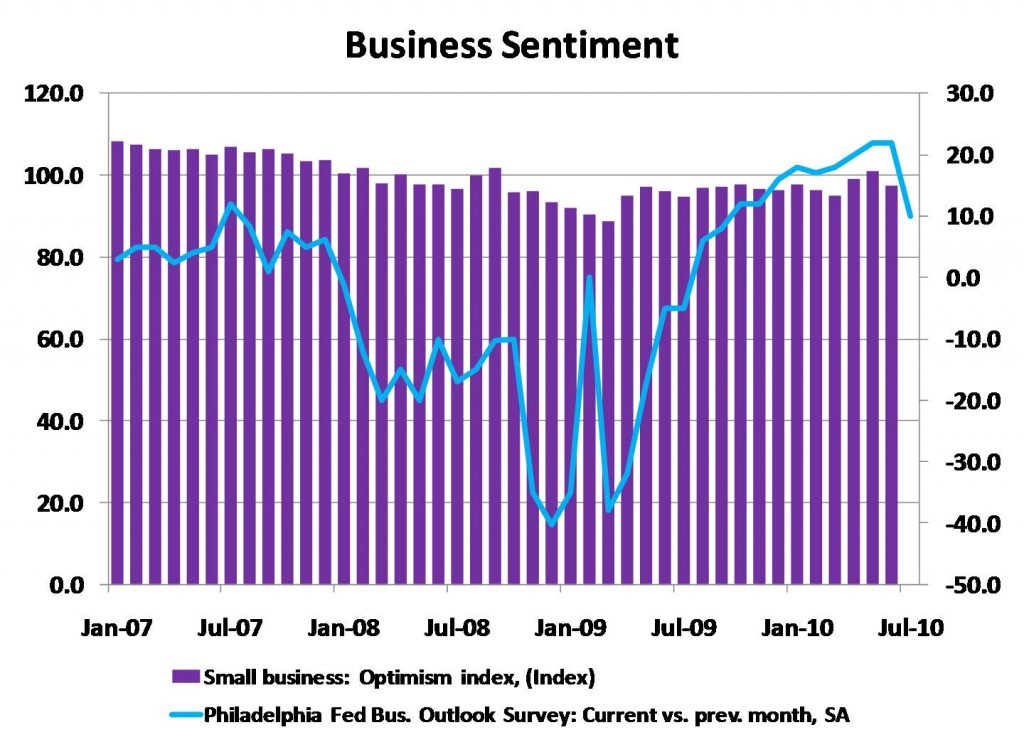
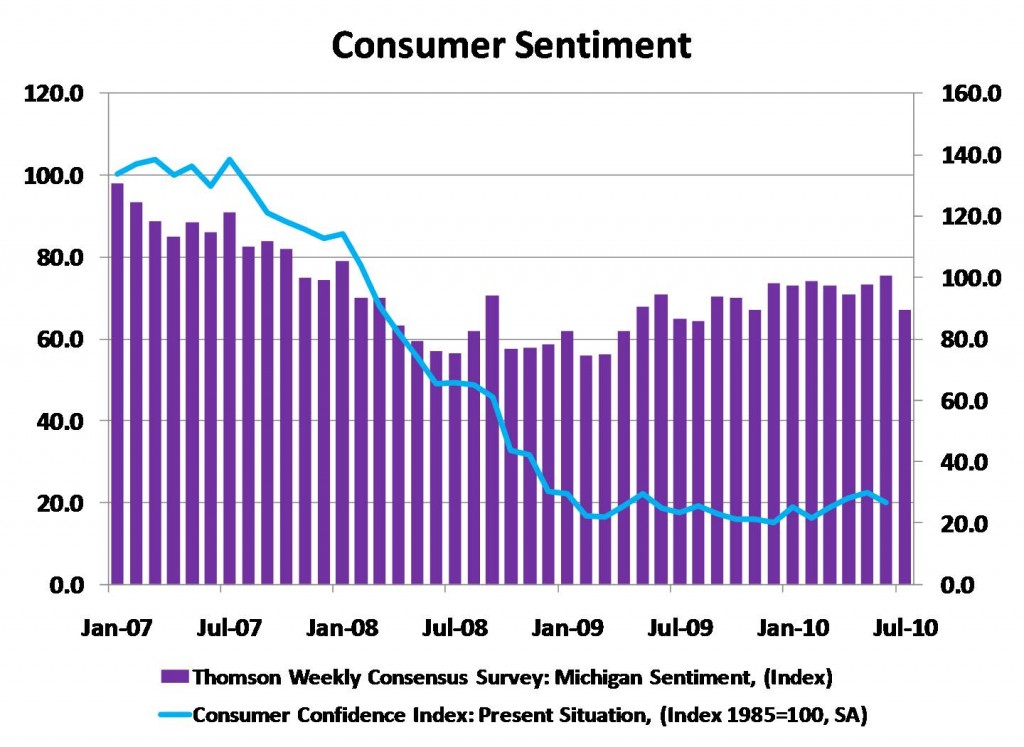
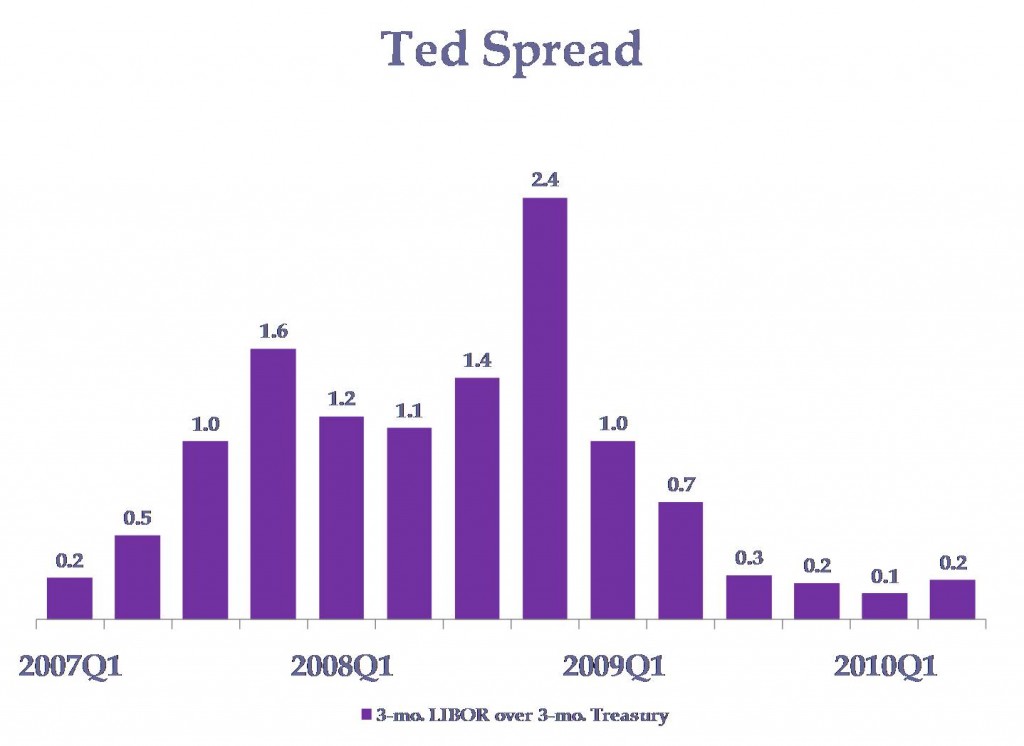
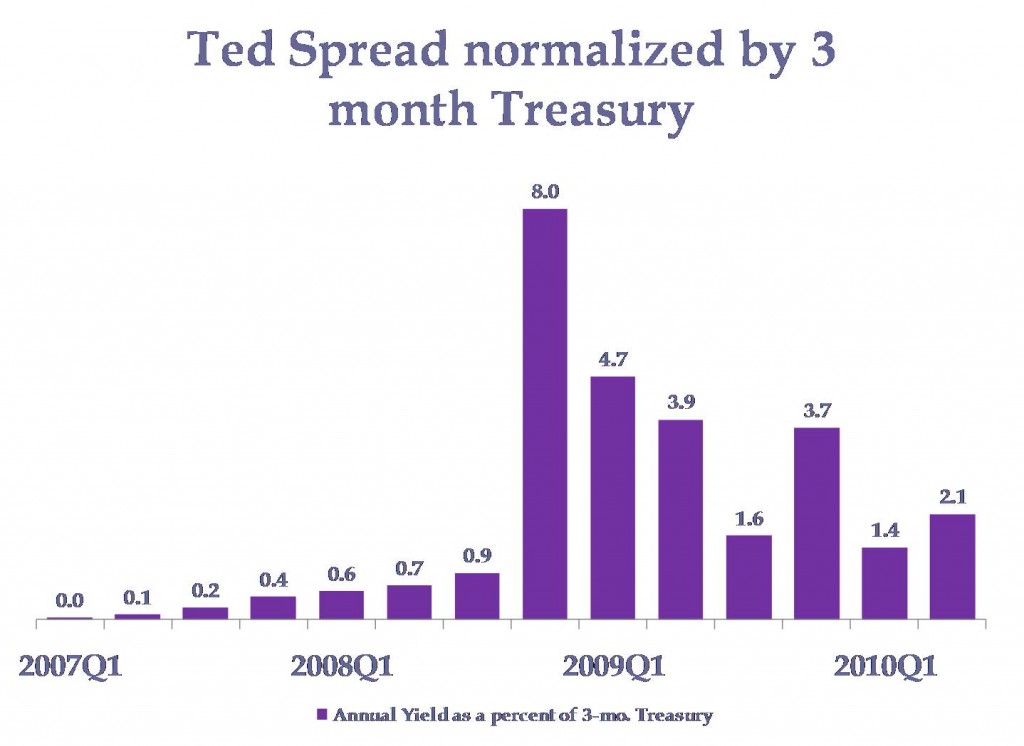
Prototypical measures of these items are: the consumer confidence index, the business sentiment index, the Ted spread and/or the normalized Ted spread, and interest spreads such as the Baa–Aaa or the Aaa–TB10Yr. The Ted spread is the 3-month LIBOR minus the 3-month Treasury, and the normalized measure divides the Ted by the 3-month Treasury. We show pictures of these measures in graphics below.
Interestingly, financial market measures clearly show late 2008 and early 2009 as being times of regime shift, whereas the various measures of consumer and business sentiment do not show this as clearly. I believe that based on these indicators and on broad measures of economic activity like GDP and jobs that the United States economy shifted to an equilibrium characterized by freezes in credit and risk-taking in the fourth quarter of 2008. In the third quarter of 2009 the economy shifted to better equilibrium, one still in force now. This is the intermediate “good-deflation” equilibrium discussed earlier.
What do these indicators tell us now? The blue line consumer confidence measure on the Consumer Sentiment graphic fell dramatically every month from July 2007 through 2008. Since then, it has remained flat at a very low level. This might not be a good sign. The various credit spreads indicate that conditions are much better now than they were in late 2008, but conditions have not returned to normal.
Both of the bond spreads shown here have been climbing rapidly for 2 months. If this continues many more months we would have a key indicator telling us that those market conditions were changing or had changed to a worse equilibrium. This would not necessarily mean the entire economy had changed. I would be more convinced the entire economy had changed or was changing to a bad equilibrium if all of the indicators move dramatically in that direction.
I urge our clients to watch these indicators. I will monitor them, and provide occasional updates in this blog-space.

